Fig. 4
Download original image
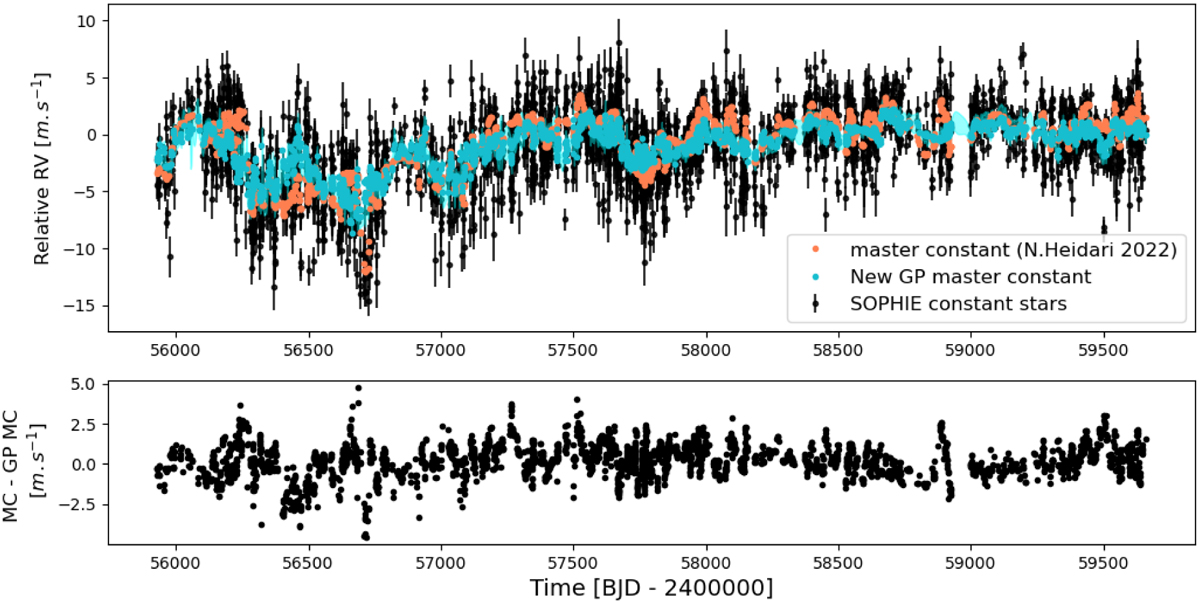
Result of the fit of the NZP with GPs. Upper panel: SOPHIE RVs for the constant stars are represented as black dots with error bars. The master constant time series developed by Heidari et al. (2024) is represented as orange dots. The new GP master constant developed in this work and trained on the constant stars is represented with blue dots, and the blue shaded area represents the corresponding uncertainties. Lower panel: difference between the master constant method (MC) and the GP master constant method (GP MC).
Current usage metrics show cumulative count of Article Views (full-text article views including HTML views, PDF and ePub downloads, according to the available data) and Abstracts Views on Vision4Press platform.
Data correspond to usage on the plateform after 2015. The current usage metrics is available 48-96 hours after online publication and is updated daily on week days.
Initial download of the metrics may take a while.