Fig. A.1
Download original image
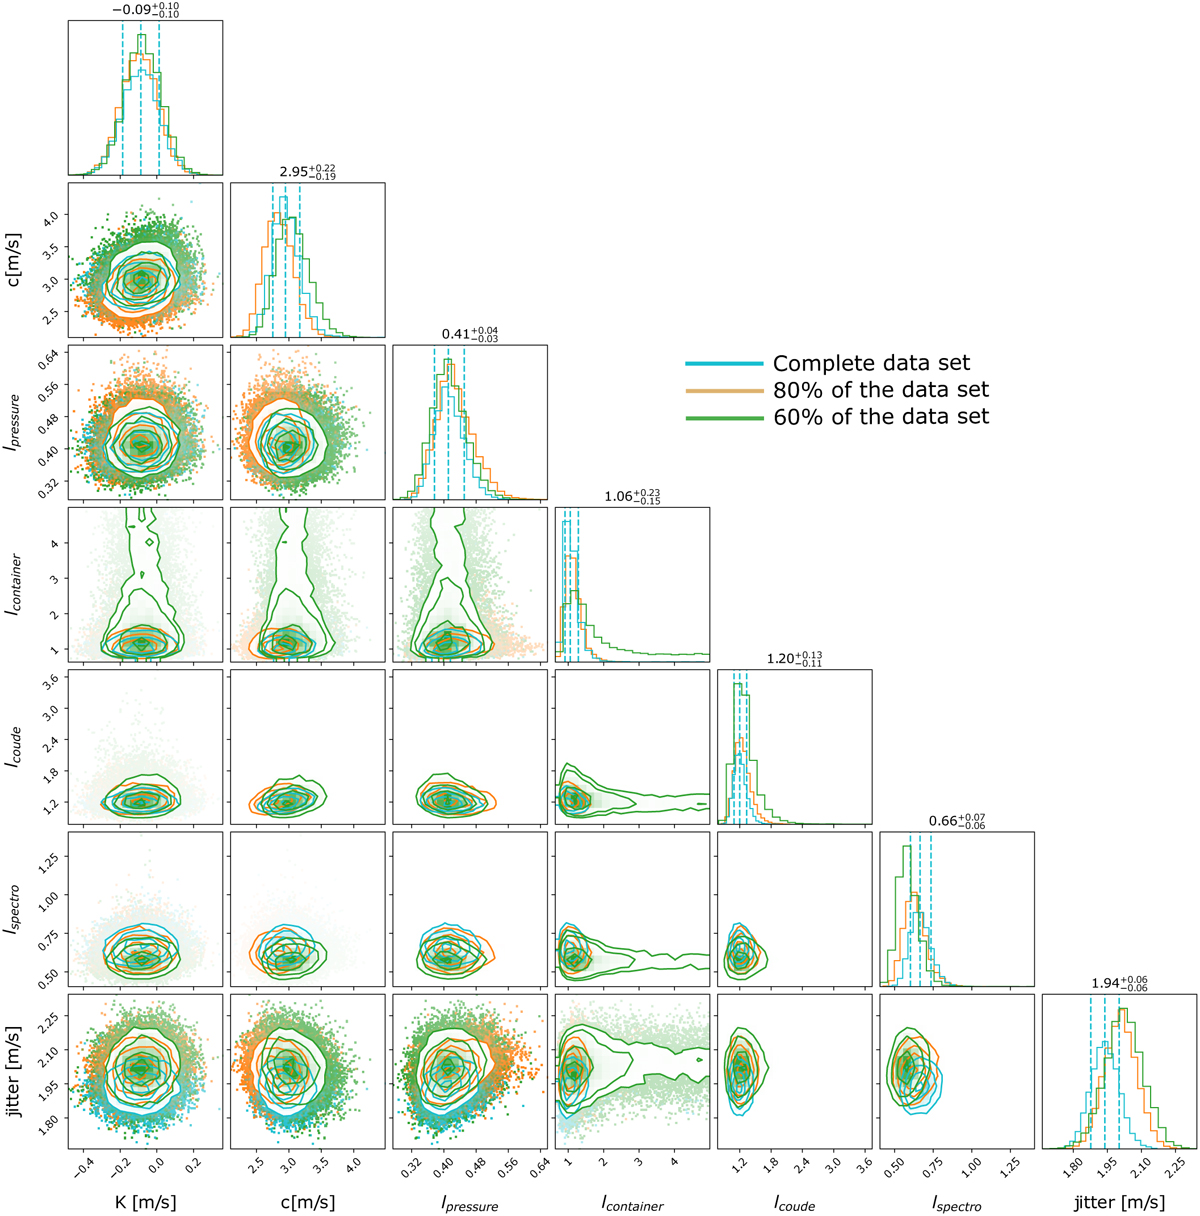
Correlation diagram for the posterior density functions of all parameters for the GP analysis of the constant stars with BJD<2457700 days. The blue histogram corresponds to the complete dataset with all constant stars available. The orange histograms are the results for 80% of this dataset, and the green histogram shows this for 60% of this dataset. The dotted blue lines show the median values for the complete dataset and limit the 68.3% highest density intervals. The corresponding values are written above each parameter.
Current usage metrics show cumulative count of Article Views (full-text article views including HTML views, PDF and ePub downloads, according to the available data) and Abstracts Views on Vision4Press platform.
Data correspond to usage on the plateform after 2015. The current usage metrics is available 48-96 hours after online publication and is updated daily on week days.
Initial download of the metrics may take a while.