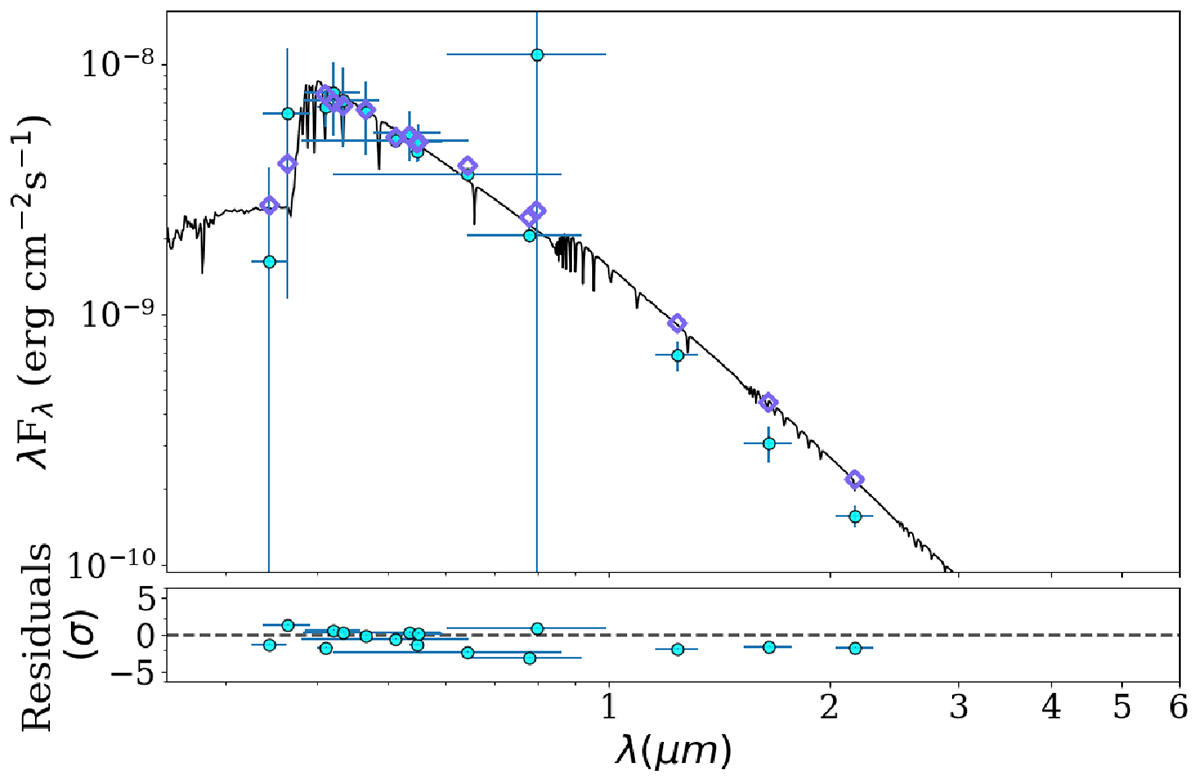
Fig. 5.
Download original image
Same as Fig. 4 but here we show the output plot generated by astroARIADNE. The synthetic photometry is shown via the cyan points; the purple diamonds show the fit points. The synthetic spectrum is a spectrum with the parameters Teff = 9500 K, log g = 3.5 and [Fe/H]= − 0.1 dex taken from Kurucz (1993). This method probes a smaller wavelength range so that no IR excess can be seen here.
Current usage metrics show cumulative count of Article Views (full-text article views including HTML views, PDF and ePub downloads, according to the available data) and Abstracts Views on Vision4Press platform.
Data correspond to usage on the plateform after 2015. The current usage metrics is available 48-96 hours after online publication and is updated daily on week days.
Initial download of the metrics may take a while.