Fig. 4.
Download original image
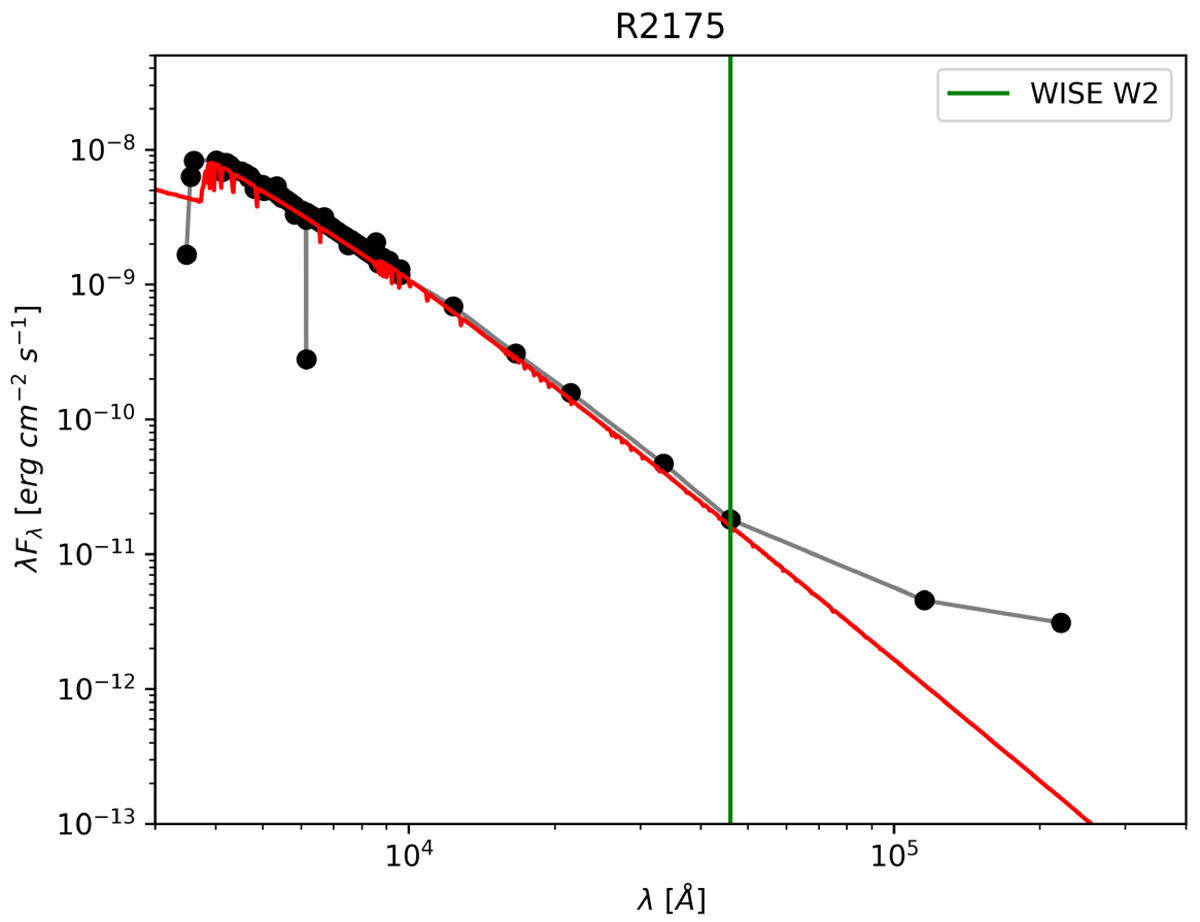
Spectral energy distribution for the star R2175 (Gaia DR3 3326717260430731648) as measured by VOSA (black dots). The red spectrum is a model from Castelli (2003) with the parameters Teff = 13 000 K, log g = 4.0 and [Fe/H]= − 0.5 dex. The vertical green line denotes the effective wavelength of the WISE W2 band from the point at which the measured SED deviates from the model spectrum, and the IR excess starts to show.
Current usage metrics show cumulative count of Article Views (full-text article views including HTML views, PDF and ePub downloads, according to the available data) and Abstracts Views on Vision4Press platform.
Data correspond to usage on the plateform after 2015. The current usage metrics is available 48-96 hours after online publication and is updated daily on week days.
Initial download of the metrics may take a while.