Table 4.
Correlation analysis results: T10+S23+C21 UFOs sub-sample.
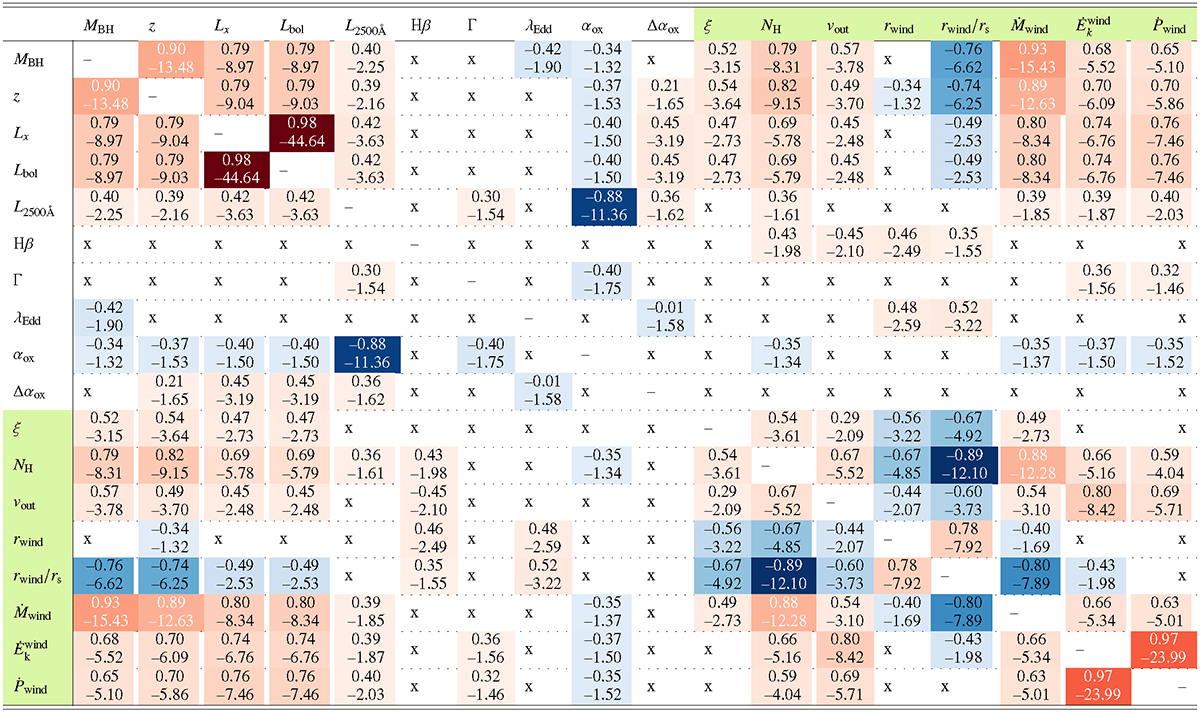
Notes. For each pair, the Spearman correlation coefficient is reported (top), along with the logarithm of the NHP (bottom). If the latter is larger than –1.30, we consider the correlation with low significance and an “X” is shown. Cells displaying positive correlations are shaded in red, with darker shades indicating more significant correlations. Conversely, cells representing negative correlations are shaded in blue, following the same shading scheme. Additionally, cells highlighted in green within the first row and column indicate correlations involving at least one UFO parameter.
Current usage metrics show cumulative count of Article Views (full-text article views including HTML views, PDF and ePub downloads, according to the available data) and Abstracts Views on Vision4Press platform.
Data correspond to usage on the plateform after 2015. The current usage metrics is available 48-96 hours after online publication and is updated daily on week days.
Initial download of the metrics may take a while.