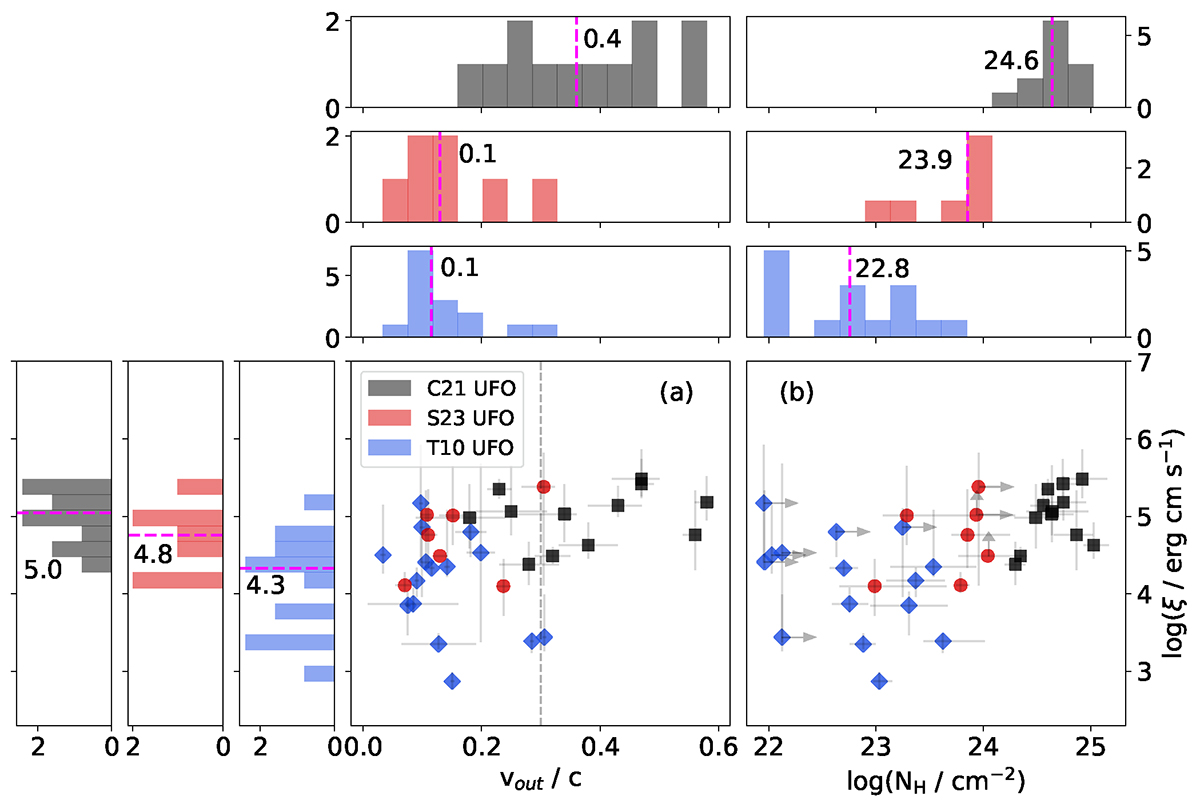
Fig. 3.
Download original image
Sample comparison of outflow parameters. Panel a: outflow velocity as a function of the ionization parameter. AGNs on the right side of the dashed gray line host potentially magnetically driven winds, see text for details. Panel b: ionization parameter versus the outflow equivalent column density. The gray arrows represent the upper/lower limits for the log(ξ) and NH values (see Table A.2). The S23 UFO sub-sample is shown in red circles, T10 in blue diamonds, and C21 in black squares. The dashed magenta lines show the median value of each sub-sample.
Current usage metrics show cumulative count of Article Views (full-text article views including HTML views, PDF and ePub downloads, according to the available data) and Abstracts Views on Vision4Press platform.
Data correspond to usage on the plateform after 2015. The current usage metrics is available 48-96 hours after online publication and is updated daily on week days.
Initial download of the metrics may take a while.