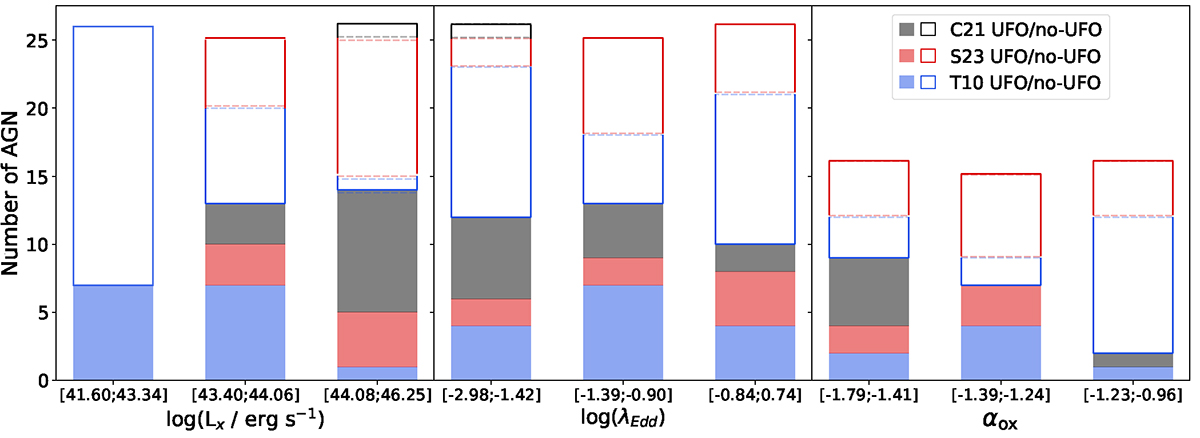
Fig. 2.
Download original image
Number of AGNs in three X-ray luminosity (left panel), Eddington ratio (central panel), and αox (right panel) bins for the analyzed sample and sub-samples. In solid colors (black for C21, red for S23, and blue for T10) the UFO sub-samples are shown, while the colored (the same color palette is adopted) solid lines represent the no-UFO sub-samples.
Current usage metrics show cumulative count of Article Views (full-text article views including HTML views, PDF and ePub downloads, according to the available data) and Abstracts Views on Vision4Press platform.
Data correspond to usage on the plateform after 2015. The current usage metrics is available 48-96 hours after online publication and is updated daily on week days.
Initial download of the metrics may take a while.