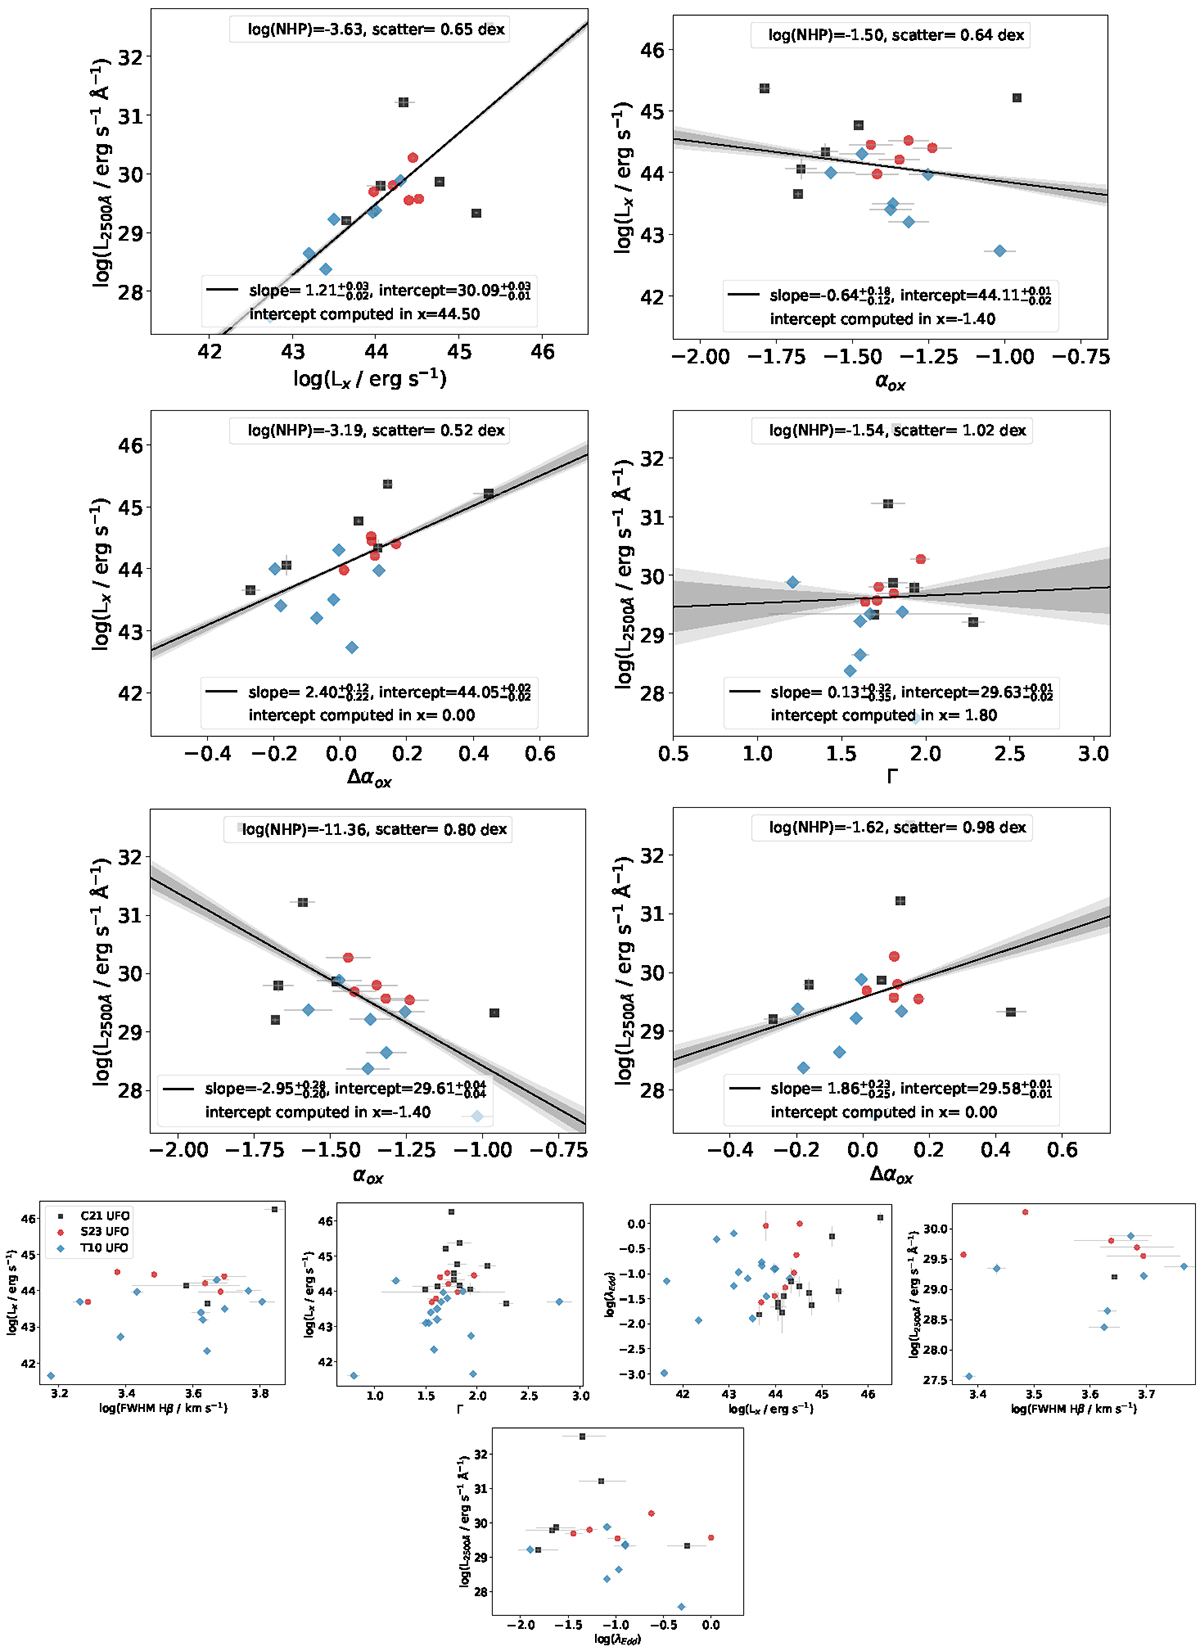
Fig. D.3.
Download original image
X-ray and UV luminosity versus AGN parameters. Significant and nonsignificant correlations for the S23, T10, and C21 samples. The best-fitting linear correlations, applied exclusively to statistically significant correlations, are presented by the solid black lines and the dark and light gray shadowed areas indicate the 68% and 90% confidence bands, respectively.
Current usage metrics show cumulative count of Article Views (full-text article views including HTML views, PDF and ePub downloads, according to the available data) and Abstracts Views on Vision4Press platform.
Data correspond to usage on the plateform after 2015. The current usage metrics is available 48-96 hours after online publication and is updated daily on week days.
Initial download of the metrics may take a while.