Fig. C.4.
Download original image
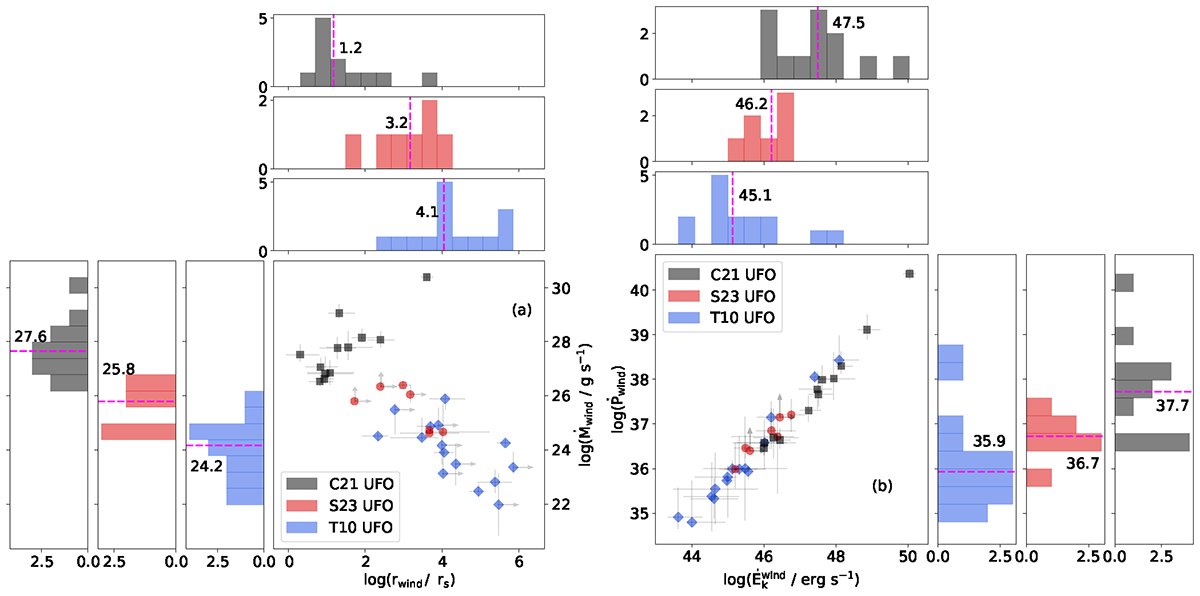
Samples comparison of outflow derived properties. Panel a: Distance between the wind and the SMBH versus mass outflow rate. Panel b: Kinetic power versus outflow momentum rate. Each UFO sub-sample follows the same color/marker code as Fig. C.1. The dashed magenta lines show the median values. The gray arrows represent the upper/lower limits for the log(ξ) and NH values (see Table A.2). We observe statistically significant differences for the launching radius and energetics of the wind (see Sect. 4.3).
Current usage metrics show cumulative count of Article Views (full-text article views including HTML views, PDF and ePub downloads, according to the available data) and Abstracts Views on Vision4Press platform.
Data correspond to usage on the plateform after 2015. The current usage metrics is available 48-96 hours after online publication and is updated daily on week days.
Initial download of the metrics may take a while.