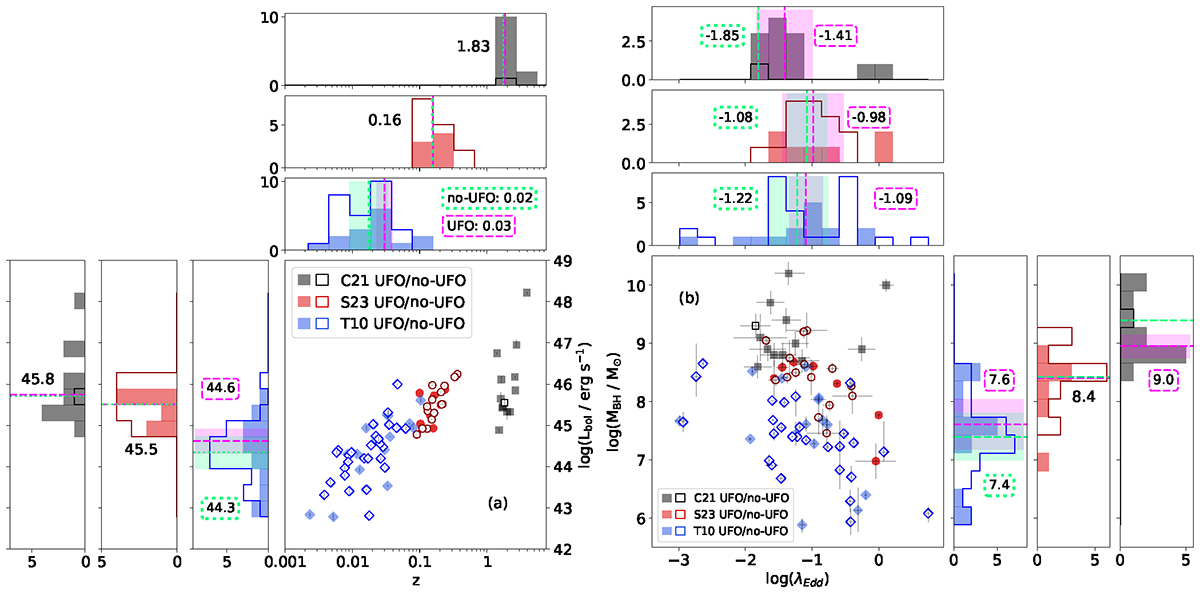
Fig. C.2.
Download original image
Samples comparison of AGN properties. Alongside Table C.1 and Fig. C.3, we obtained no substantial evidence indicating differences between AGNs hosting UFOs and those without. This suggests that all AGNs might be capable of hosting these outflows during their lifetime and their observability is linked to the wind duty cycle (see Sect. 4.2). Panel a: Bolometric luminosity versus redshift. Panel b: SMBH mass versus Eddington ratio. The S23 sample is shown in red circles, T10 sample in blue diamonds and C21 sample in black squares. For each distribution and scatter plot, the UFO sub-samples are represented as color filled histograms and dots, respectively. The dashed magenta and dotted green lines show the median value of each UFO and no-UFO sub-sample, respectively. We report both median values only when these are different and we include the corresponding 1σ error-bars on the median.
Current usage metrics show cumulative count of Article Views (full-text article views including HTML views, PDF and ePub downloads, according to the available data) and Abstracts Views on Vision4Press platform.
Data correspond to usage on the plateform after 2015. The current usage metrics is available 48-96 hours after online publication and is updated daily on week days.
Initial download of the metrics may take a while.