Fig. 10.
Download original image
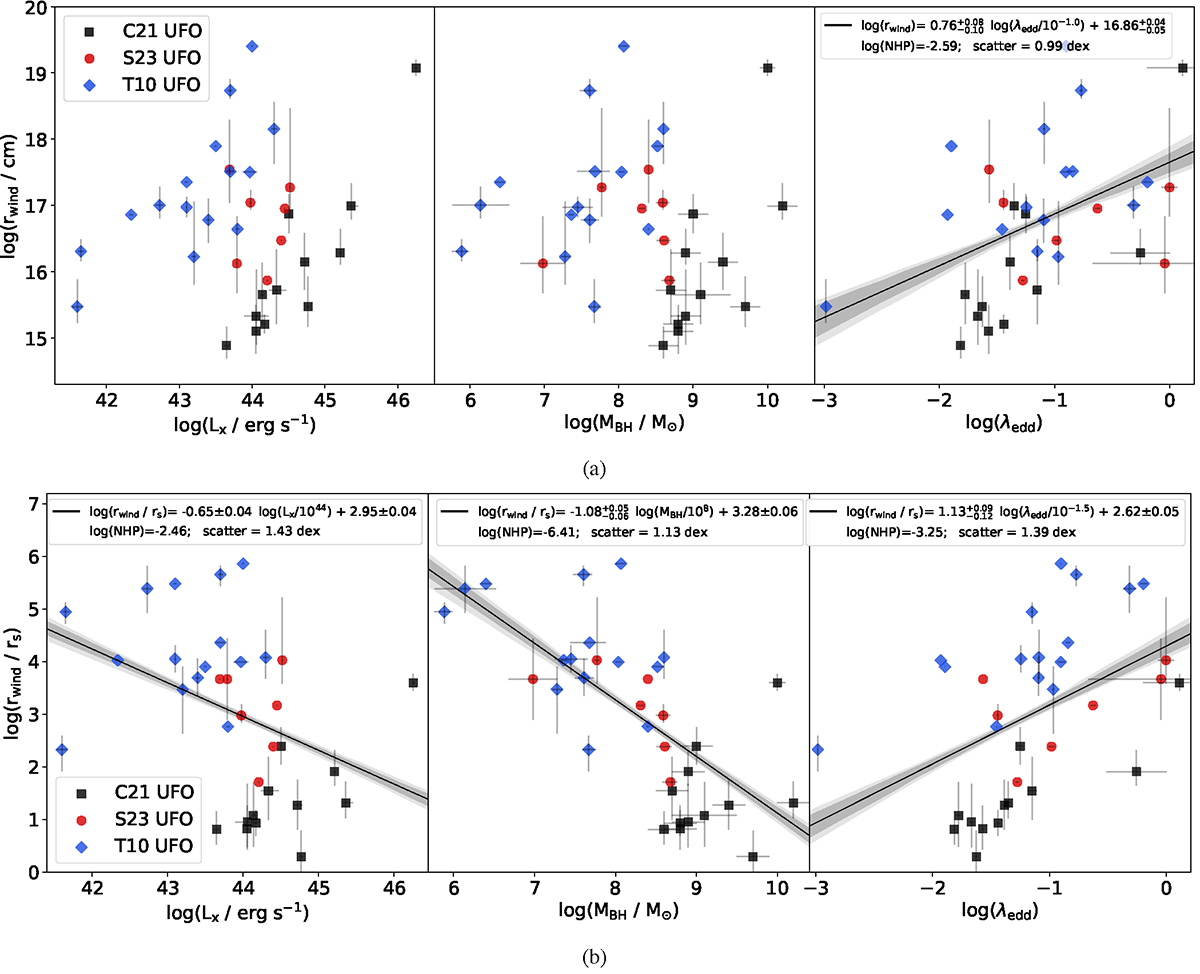
Correlations between the X-ray luminosity, SMBH mass, Eddington ratio, and the wind radii. Panel a: correlations considering rwind. Panel b: correlations considering rwind normalized for rs. The S23 UFO sub-sample is shown in red circles, T10 in blue diamonds, and C21 in black squares. The solid lines represent the best-fitting linear correlation and the dark and light gray shadowed areas indicate the 68% and 90% confidence bands, respectively. In the legend, we report the best-fit coefficients, logNHP, and the intrinsic scatters for the correlations. The correlations are not significant where the best-fit and the confidence bands are not reported.
Current usage metrics show cumulative count of Article Views (full-text article views including HTML views, PDF and ePub downloads, according to the available data) and Abstracts Views on Vision4Press platform.
Data correspond to usage on the plateform after 2015. The current usage metrics is available 48-96 hours after online publication and is updated daily on week days.
Initial download of the metrics may take a while.