Fig. 1.
Download original image
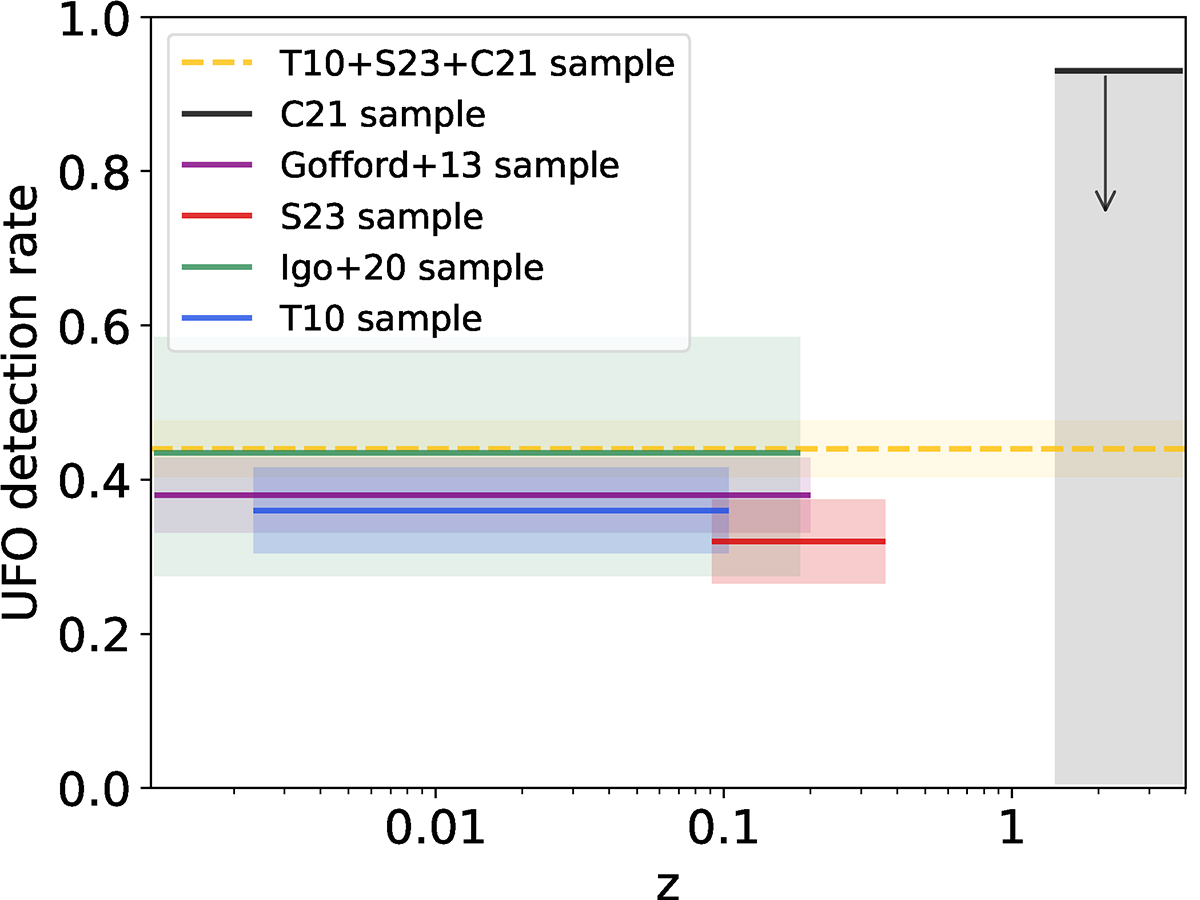
Percentage of UFO detections at > 95% confidence level. The red symbolize S23, T10 is in blue, and C21 is shown with black. The upper limit to the detection fraction of AGNs hosting UFOs at high redshift is represented by the C21 sample due to its selection bias toward AGNs hosting UFOs. The hatched dark yellow line represent the total UFOs fraction in the combined sample (34/77 = 44%). We report in green and purple the fractions obtained by Igo et al. (2020) and Gofford et al. (2013). The colored bands indicate 68% confidence intervals, calculated adopting the Bayesian approach described in Cameron (2011). In the case of Igo et al. (2020), the lower limit of the shaded area represents the detection rate for sources with strong evidence of UFOs, whereas the upper limit encompasses the total rate (strong + weak evidence).
Current usage metrics show cumulative count of Article Views (full-text article views including HTML views, PDF and ePub downloads, according to the available data) and Abstracts Views on Vision4Press platform.
Data correspond to usage on the plateform after 2015. The current usage metrics is available 48-96 hours after online publication and is updated daily on week days.
Initial download of the metrics may take a while.