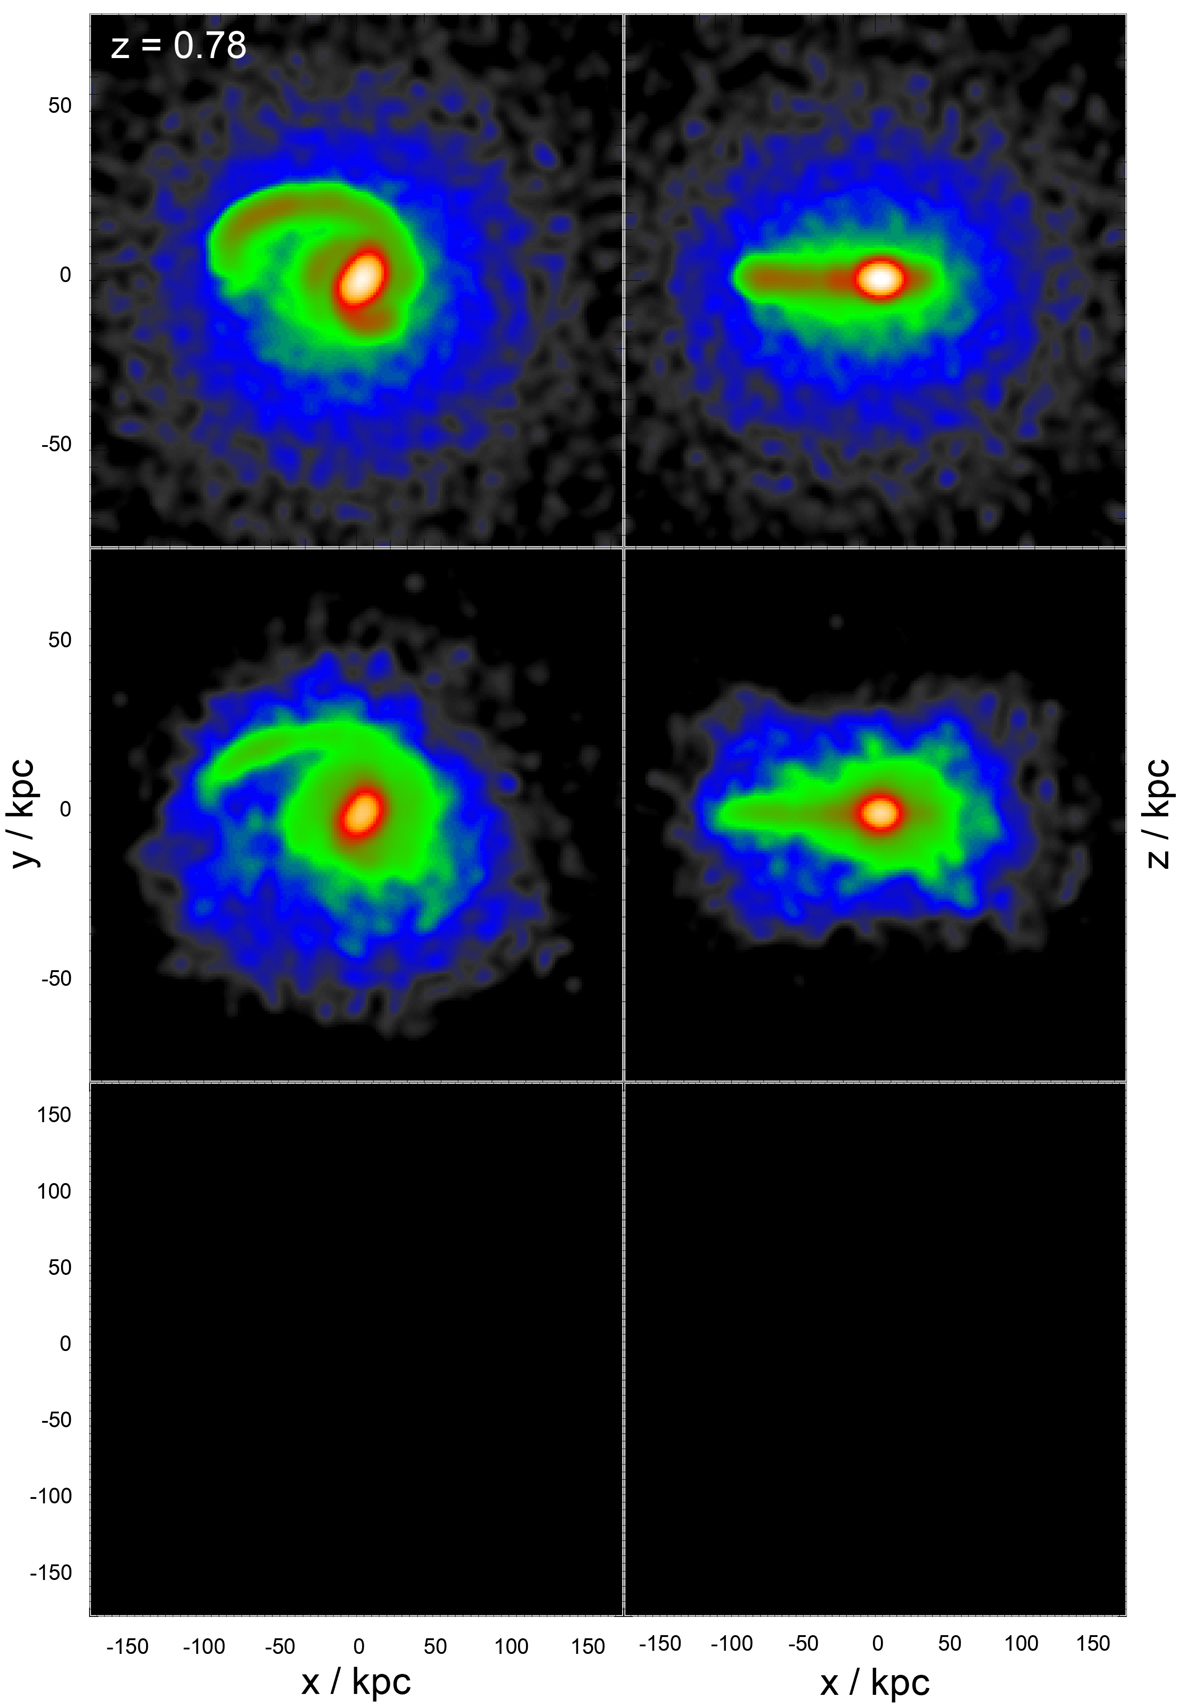
Fig. C.5.
Download original image
Type 5 images at z = 0.78. Top to bottom - gas, stars; left to right - face-on, edge-on. The size of the panels is 157.5 kpc for gas and stars showing the central regions in more detail. (Note that there was no dark matter component included in this simulation.) For an animation of this simulation showing the particle images see https://youtu.be/NCnqIOLRyDg. The panels in the animation are in the same configuration as this figure, and also have a width of 157.5 kpc. Density contours in this figure were rendered logarithmically, from black (< 0.05 M⊙pc−2), blue (∼ 0.5 M⊙pc−2), green (∼ 5 M⊙pc−2), red (∼ 50 M⊙pc−2), to white (> 1000 M⊙pc−2). See online movie.
Current usage metrics show cumulative count of Article Views (full-text article views including HTML views, PDF and ePub downloads, according to the available data) and Abstracts Views on Vision4Press platform.
Data correspond to usage on the plateform after 2015. The current usage metrics is available 48-96 hours after online publication and is updated daily on week days.
Initial download of the metrics may take a while.