Fig. 7.
Download original image
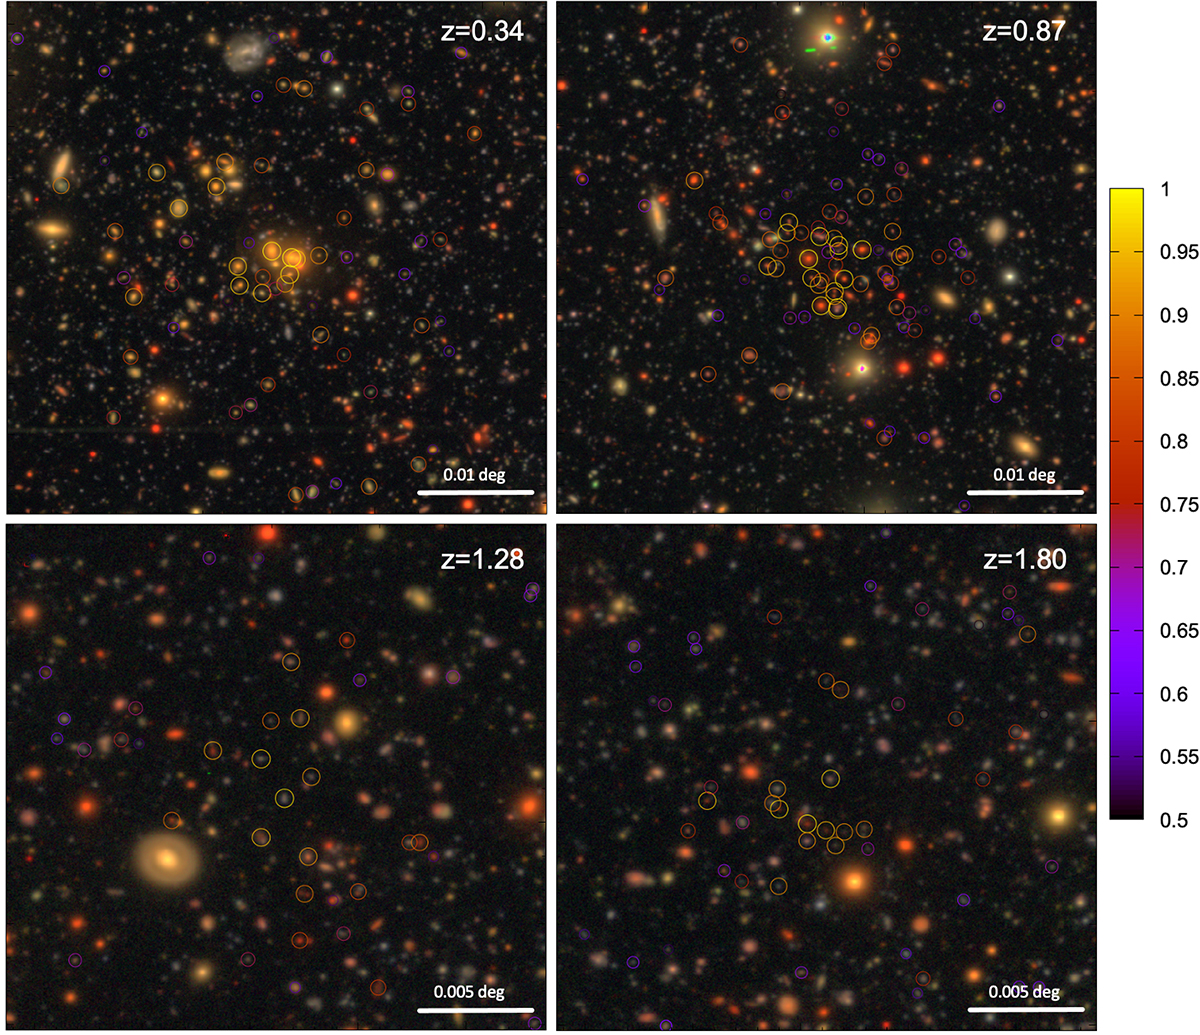
Four examples of detections at different redshifts as identified in the r-band run. Stamps are HSC g, r, i colour-composite images centred on the AMICO detection, with a side of 0.05 deg for the top panels and 0.025 deg for the bottom panels. The circles indicate the associated galaxies, sized and coloured according to their association probability (see colour bar at right). Top left: candidate at z = 0.34 with λ⋆ ∼ 17; top right: candidate at z = 0.87 with λ⋆ ∼ 27; bottom left: candidate at z = 1.28 with λ⋆ ∼ 26; bottom right: candidate at z = 1.80 with λ⋆ ∼ 40.
Current usage metrics show cumulative count of Article Views (full-text article views including HTML views, PDF and ePub downloads, according to the available data) and Abstracts Views on Vision4Press platform.
Data correspond to usage on the plateform after 2015. The current usage metrics is available 48-96 hours after online publication and is updated daily on week days.
Initial download of the metrics may take a while.