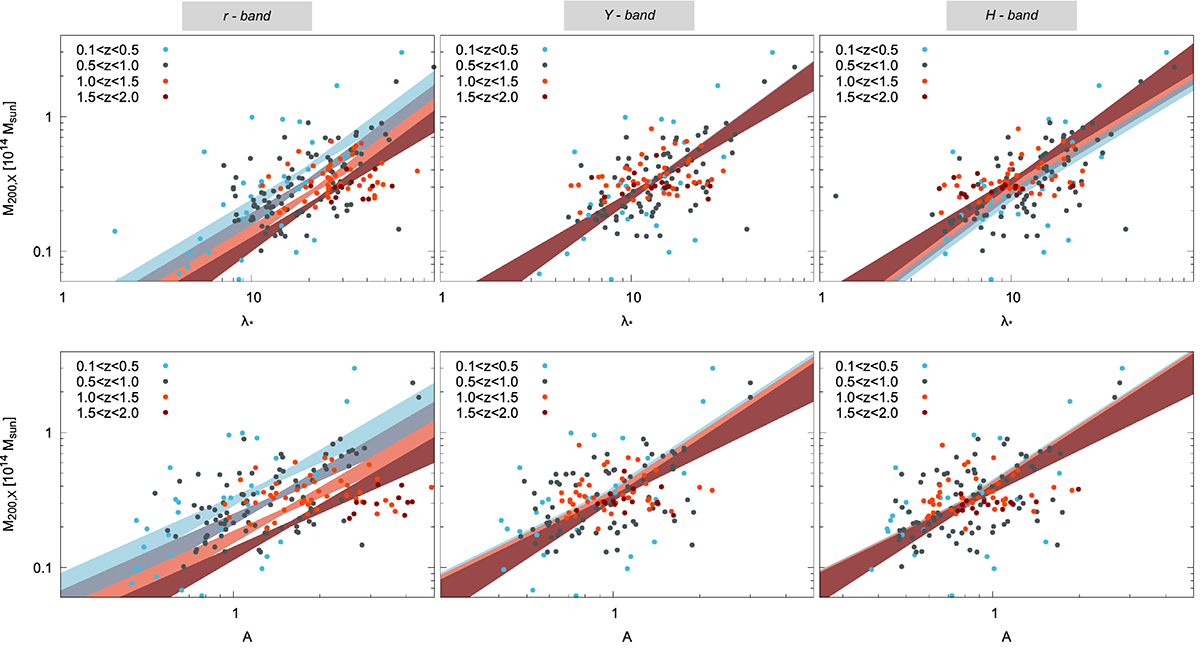
Fig. 13.
Download original image
Relation between X-ray mass and richness (top panels) or amplitude (bottom panels) for the full sample including matched detections with the X-ray catalogue and new detections with X-ray flux estimate in the full redshift range, z ∈ [0.1, 2.0]. From left to right: detections from analysis in r-, Y-, and H-band. The different colours refer to the different redshift bins, as labelled in the plot. The redshift-dependent best-fitting relation is shown for typical redshift values representing the four redshift bins, z = [0.4, 0.8, 1.2, 1.6] (z increases from light blue to dark red) and with their 1σ error region. The best-fit parameters are also reported in Table 3. The redshift trend visible for r-band-based detections fades out for redder bands, where the scaling relations become consistent with no redshift dependence.
Current usage metrics show cumulative count of Article Views (full-text article views including HTML views, PDF and ePub downloads, according to the available data) and Abstracts Views on Vision4Press platform.
Data correspond to usage on the plateform after 2015. The current usage metrics is available 48-96 hours after online publication and is updated daily on week days.
Initial download of the metrics may take a while.