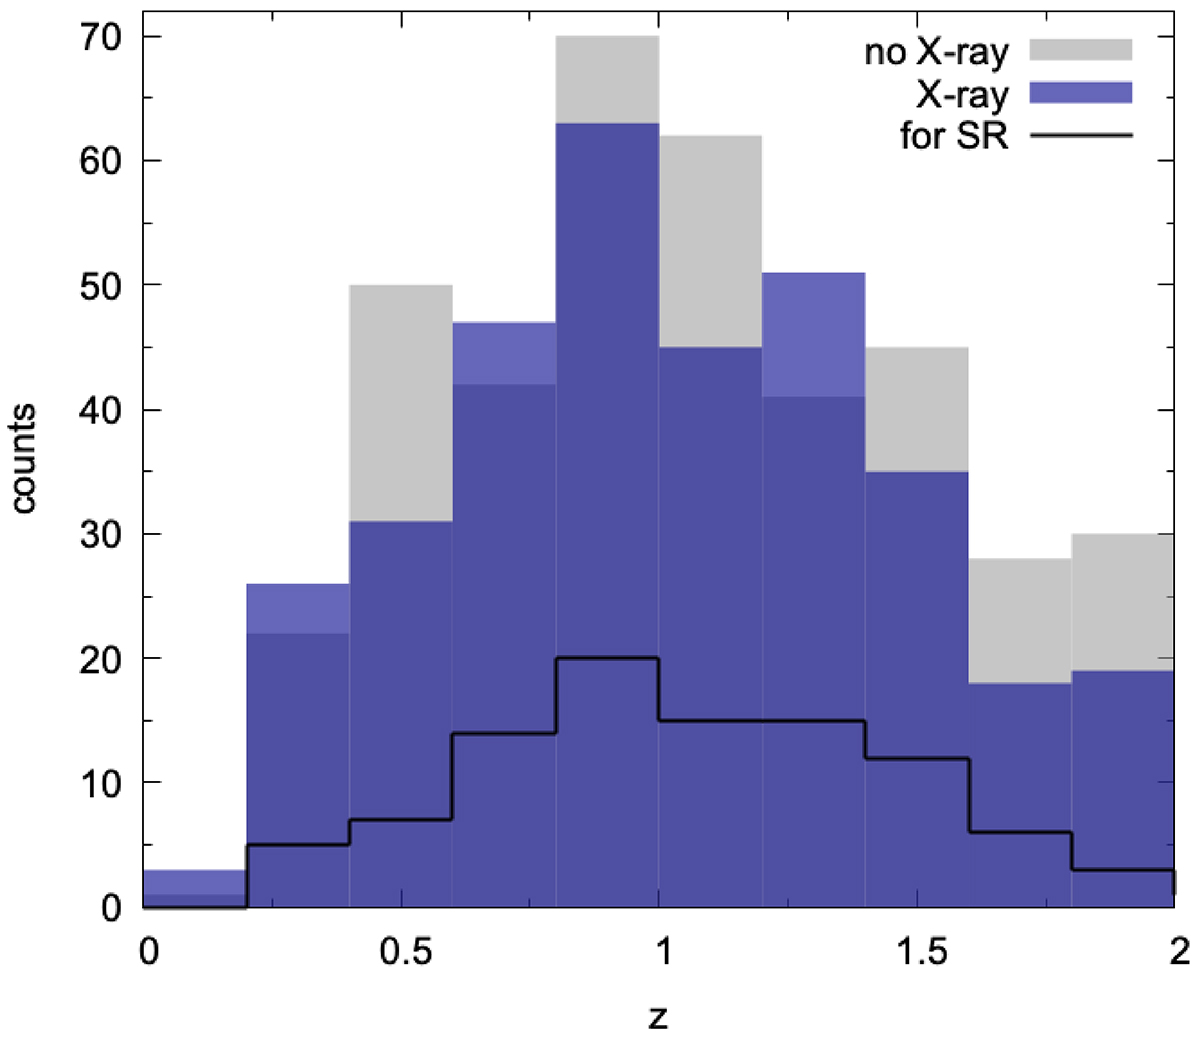
Fig. 11.
Download original image
Distribution of the redshifts of new detections analysed in X-rays (from the Y-band run catalogue). The grey histogram represents detections having X-ray flux below the 1σ significance limit. The blue histogram refers to detections with significant X-ray emission (σ > 1). The solid line highlights the subsample selected to study the scaling relation (SR) between AMICO mass-proxies and X-ray mass.
Current usage metrics show cumulative count of Article Views (full-text article views including HTML views, PDF and ePub downloads, according to the available data) and Abstracts Views on Vision4Press platform.
Data correspond to usage on the plateform after 2015. The current usage metrics is available 48-96 hours after online publication and is updated daily on week days.
Initial download of the metrics may take a while.