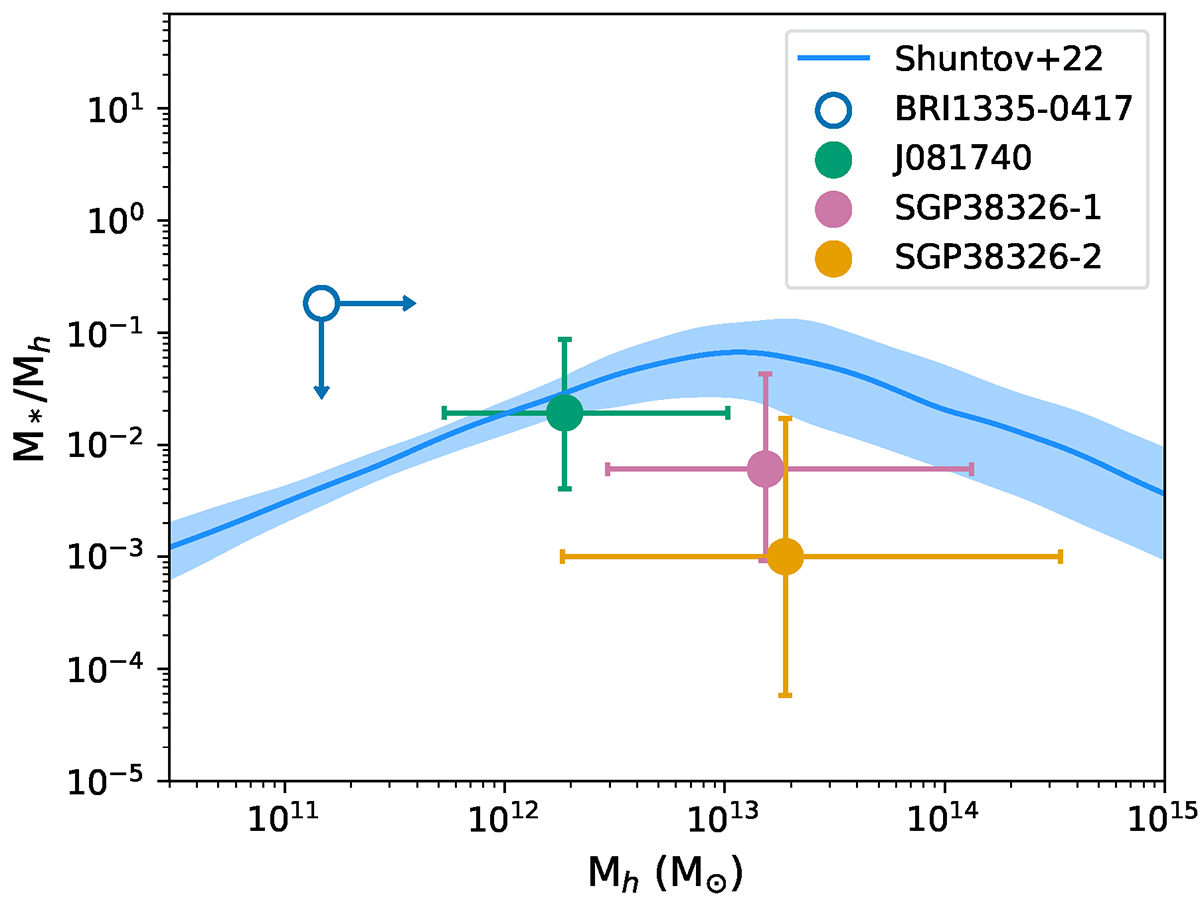
Fig. 8.
Download original image
Stellar-to-halo mass relation. We show the stellar-to-halo mass fraction on the y-axis versus the halo mass in the x axis. Our galaxies are shown as coloured circle markers according to the legend and the expected SHMR relation for central halos at 4.5 < z < 5.5 as a curve with 16th, 50th and 84th percentiles from Shuntov et al. (2022).
Current usage metrics show cumulative count of Article Views (full-text article views including HTML views, PDF and ePub downloads, according to the available data) and Abstracts Views on Vision4Press platform.
Data correspond to usage on the plateform after 2015. The current usage metrics is available 48-96 hours after online publication and is updated daily on week days.
Initial download of the metrics may take a while.