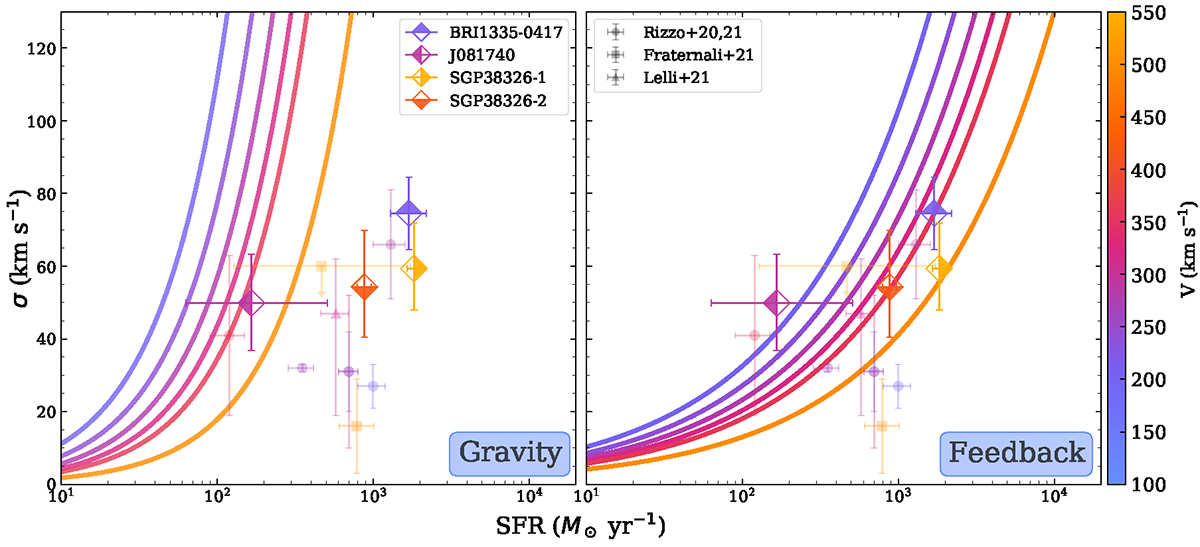
Fig. 5.
Download original image
Comparison of the observed gas velocity dispersion and star formation rate to expectations from analytical models from Krumholz et al. (2018). Left panel: different expectations from the model considering only gravitational instabilities as the driver of turbulence assuming fiducial parameters for high-z galaxies (solid lines). Right panel: different expectations from the model considering only stellar feedback as the driver of turbulence (solid lines). The models (solid lines) are colour-coded according to the maximum circular speed of the galaxies. We show our galaxies (Roman-Oliveira et al. 2023) and other resolved observations from the literature (Fraternali et al. 2021; Rizzo et al. 2021; Lelli et al. 2021) according to the legend.
Current usage metrics show cumulative count of Article Views (full-text article views including HTML views, PDF and ePub downloads, according to the available data) and Abstracts Views on Vision4Press platform.
Data correspond to usage on the plateform after 2015. The current usage metrics is available 48-96 hours after online publication and is updated daily on week days.
Initial download of the metrics may take a while.