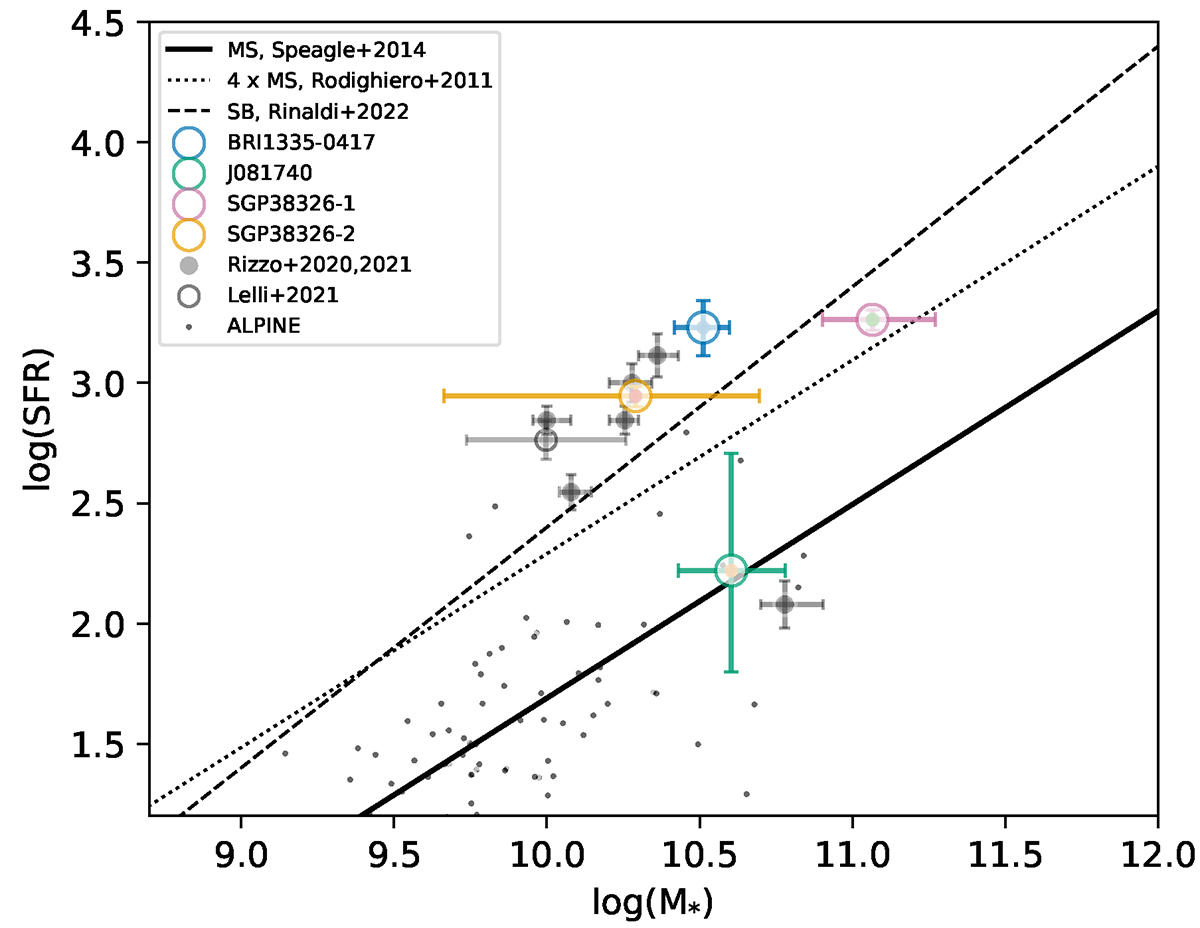
Fig. 4.
Download original image
Stellar mass vs. star formation rate. Our galaxies are represented by coloured circles according to the legend. We also show some other galaxies in the literature at similar redshift (Rizzo et al. 2020, 2021; Faisst et al. 2020; Lelli et al. 2021). The black line shows the main sequence relation at z = 4.5 from Speagle et al. (2014), while the dashed and dotted lines show the starburst/main sequence boundary according to Rodighiero et al. (2011) and Rinaldi et al. (2022), respectively.
Current usage metrics show cumulative count of Article Views (full-text article views including HTML views, PDF and ePub downloads, according to the available data) and Abstracts Views on Vision4Press platform.
Data correspond to usage on the plateform after 2015. The current usage metrics is available 48-96 hours after online publication and is updated daily on week days.
Initial download of the metrics may take a while.