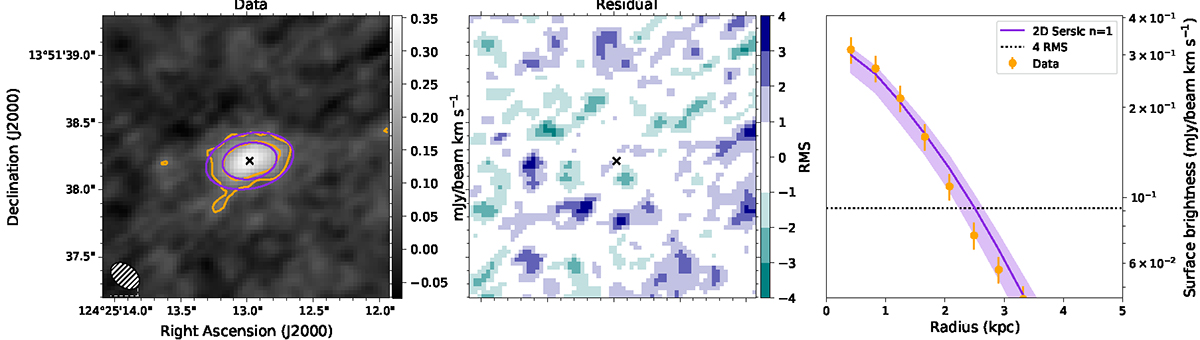
Fig. 2.
Download original image
Surface brightness profile of the dust distribution of the galaxy J081740, the other galaxies are shown in Fig. B.1. Left panel: surface brightness map of the dust continuum. The emission is shown as contours in orange for the data and in violet for the best-fit model. The contour levels follow levels of emission of 4σ, 8σ and 16σ, where σ is the RMS noise in the total map. We show the beam of the observations in the bottom left. Middle panel: residual map normalised by the RMS noise according to the colourbar shown. We show the centre of the best-fit model of the galaxy with a small cross. Right panel: 1D profile of the average gas emission in concentric ellipses (orange) and the best-fit Sérsic model (violet), the black dotted line shows the 4σ level above the noise.
Current usage metrics show cumulative count of Article Views (full-text article views including HTML views, PDF and ePub downloads, according to the available data) and Abstracts Views on Vision4Press platform.
Data correspond to usage on the plateform after 2015. The current usage metrics is available 48-96 hours after online publication and is updated daily on week days.
Initial download of the metrics may take a while.