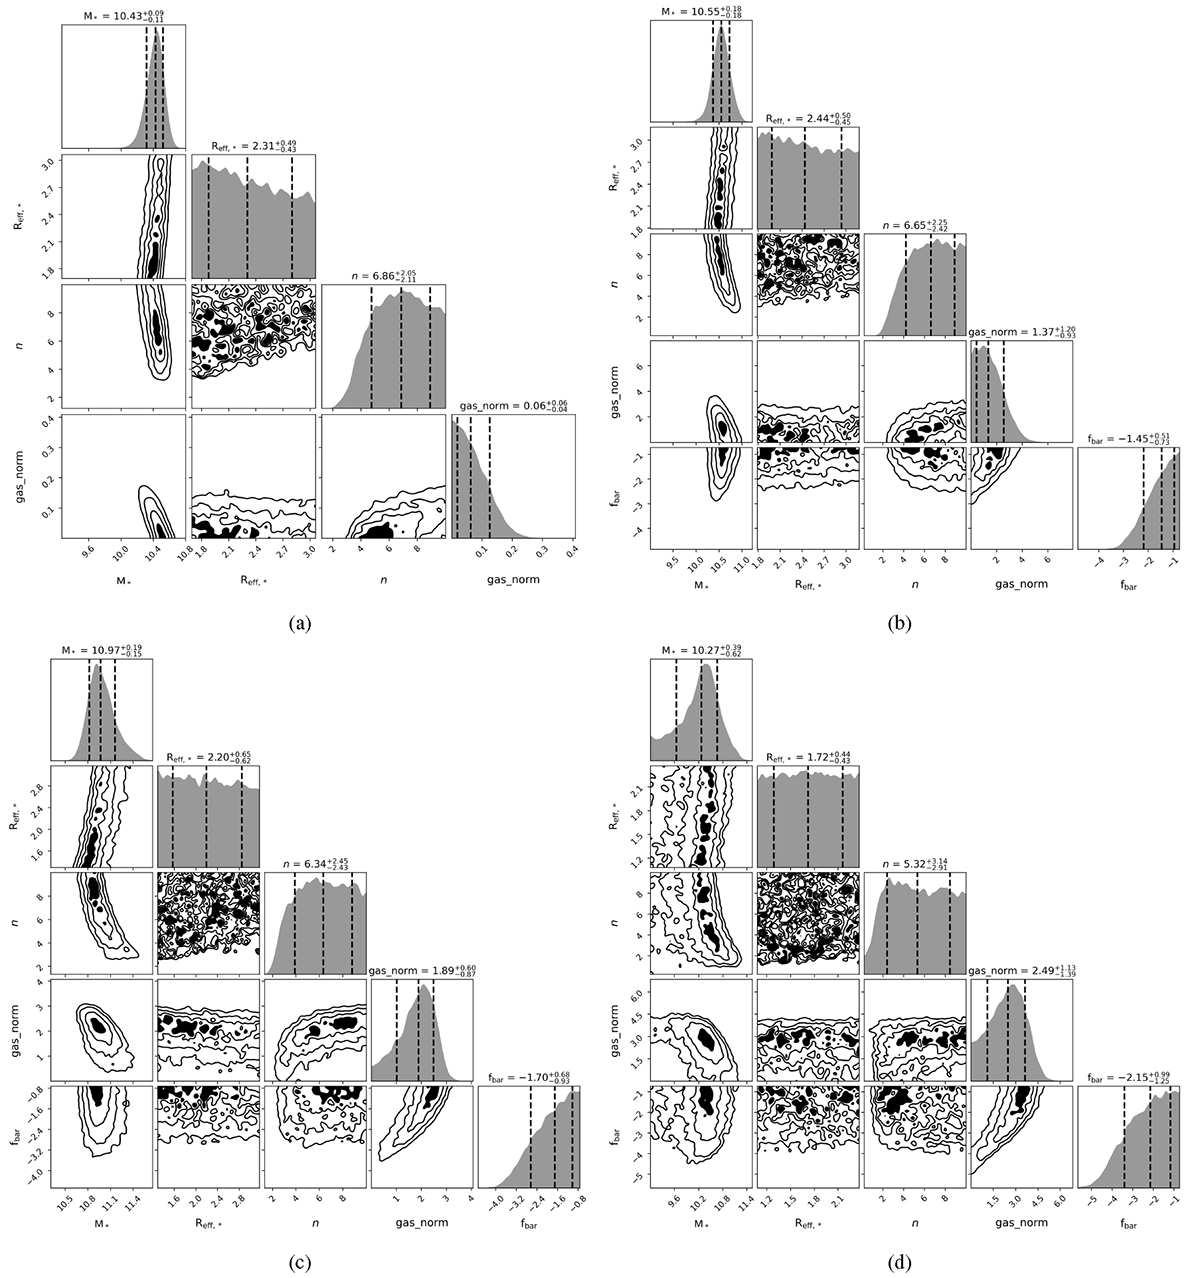
Fig. C.1.
Download original image
Corner plot with the posteriors of the best-fit dynamical models for the galaxies. The columns show: (i) the stellar mass in solar masses (logspace of M*); (ii) the effective radius of the stellar component in kpc (Reff, *); (iii) the Sérsic index of the stellar component (n); (iv) the normalisation of the gas (gas_norm); (v) the baryon fraction in logspace (fbar). Panels (a), (b), (c) and (d) are showing the results for the galaxies BRI1335-0417, J081740, SGP38326-1 and SGP38326-2, respectively. We note that for BRI1335-0417 we do not show the posterior for the baryon fraction as we fix it to the cosmological baryon fraction as discussed in Section 3.2. We show dashed lines for the best values followed by the upper and lower errors defined by the 50th, 16th and 84th percentiles, respectively.
Current usage metrics show cumulative count of Article Views (full-text article views including HTML views, PDF and ePub downloads, according to the available data) and Abstracts Views on Vision4Press platform.
Data correspond to usage on the plateform after 2015. The current usage metrics is available 48-96 hours after online publication and is updated daily on week days.
Initial download of the metrics may take a while.