Fig. 1.
Download original image
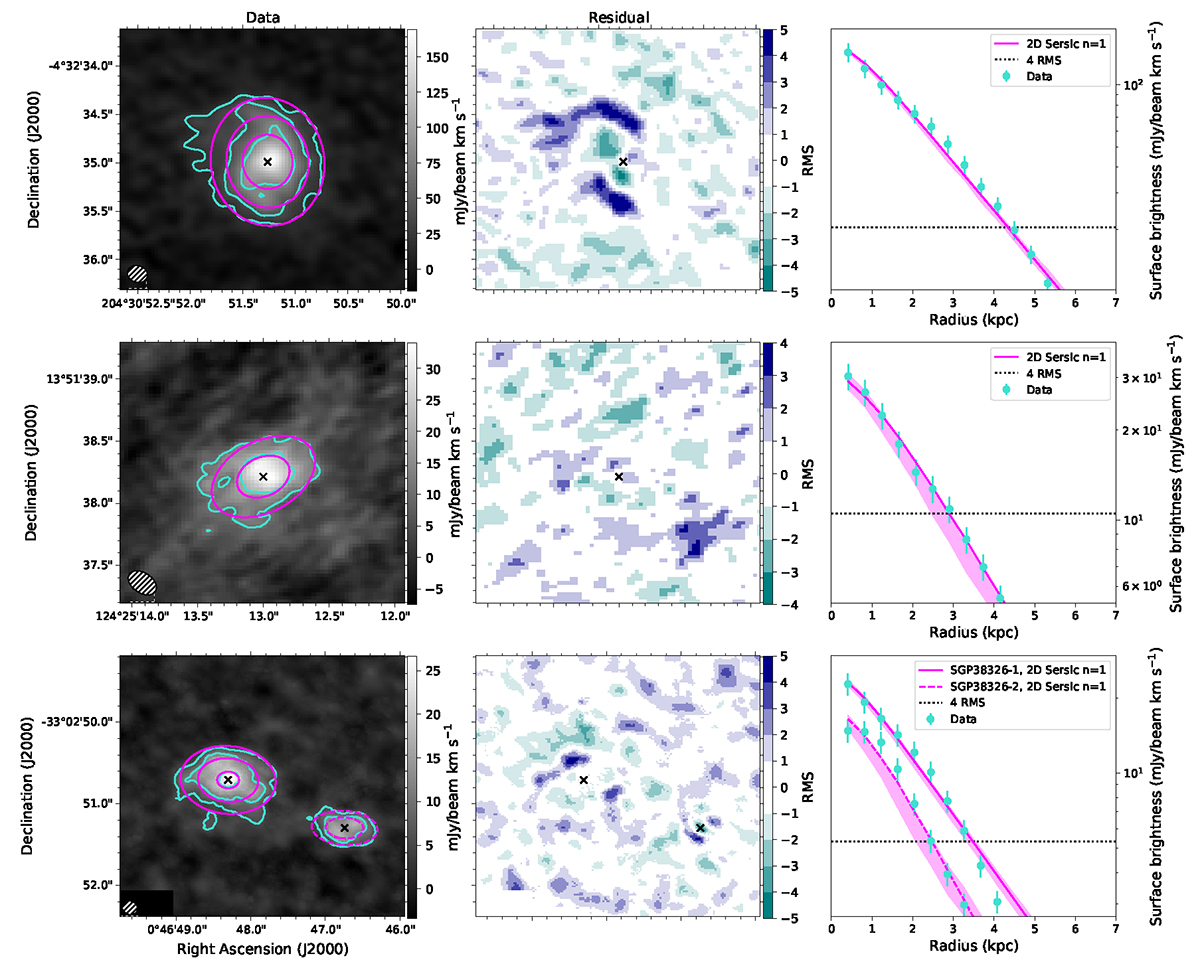
Surface brightness profiles of the gas distribution of the galaxies BRI1335−0417, J081740 and the SGP38326 system, respectively from top to bottom. Left panels: surface brightness map of the [CII] emission. The emission is shown as contours in turquoise for the data and magenta for the model. The contour levels follow levels of emission of 4σ, 8σ and 16σ, where σ is the RMS noise in the total map. We show the beam of the observations in the bottom left. Middle panel: residual map normalised by the RMS noise according to the colourbar shown. We show the centre of the best-fit model of each galaxy with a small cross. Right panel: 1D profile of the average gas emission in concentric ellipses (turquoise) and the best-fit Sérsic model (magenta), the dotted line shows the 4σ level above the noise. In the bottom panel we show the galaxies SGP38326−1 and SGP38326−2 together, as they have to be fitted simultaneously, and we mask the emission of SGP38326−3 in the bottom left corner.
Current usage metrics show cumulative count of Article Views (full-text article views including HTML views, PDF and ePub downloads, according to the available data) and Abstracts Views on Vision4Press platform.
Data correspond to usage on the plateform after 2015. The current usage metrics is available 48-96 hours after online publication and is updated daily on week days.
Initial download of the metrics may take a while.