Fig. 8.
Download original image
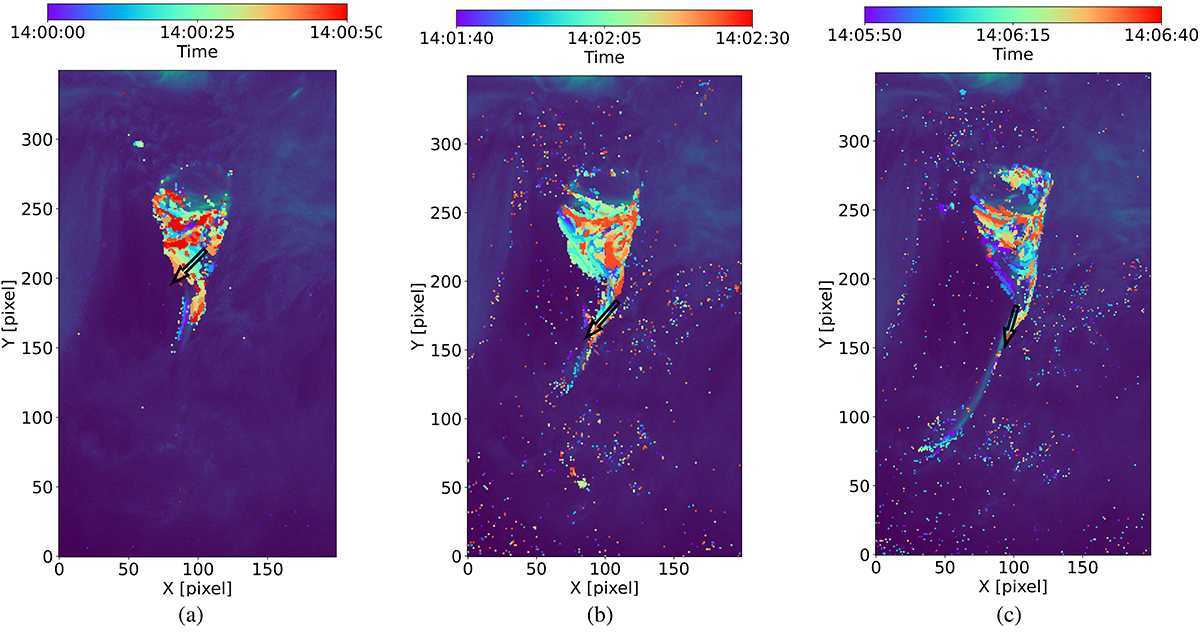
Snapshots of running ratios plotted on top of the HRIEUV images. The white arrows represent the direction of plasma material movement. The color bar represents intervals of time used to construct the running ratio.
Current usage metrics show cumulative count of Article Views (full-text article views including HTML views, PDF and ePub downloads, according to the available data) and Abstracts Views on Vision4Press platform.
Data correspond to usage on the plateform after 2015. The current usage metrics is available 48-96 hours after online publication and is updated daily on week days.
Initial download of the metrics may take a while.