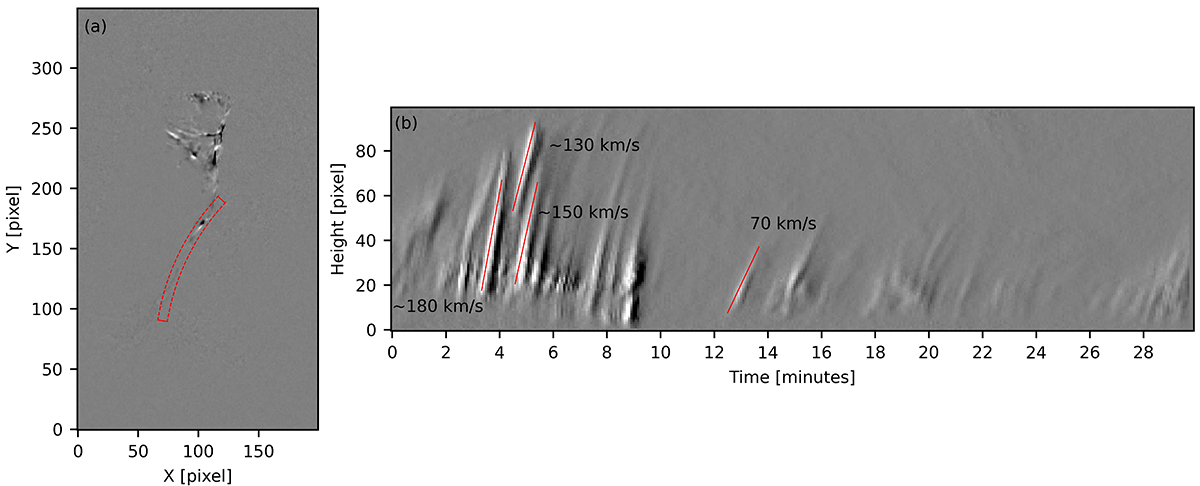
Fig. 7.
Download original image
Time-distance map demonstrating the propagation. Panel a shows a snapshot of the difference movie with the highlighted region (red dashed curves) that was used to create a time-distance map. Panel b shows the time-distance map where propagating material is clearly visible. Red lines represent fits to the propagating wave fronts with their annotated values of propagation velocity.
Current usage metrics show cumulative count of Article Views (full-text article views including HTML views, PDF and ePub downloads, according to the available data) and Abstracts Views on Vision4Press platform.
Data correspond to usage on the plateform after 2015. The current usage metrics is available 48-96 hours after online publication and is updated daily on week days.
Initial download of the metrics may take a while.