Fig. 6.
Download original image
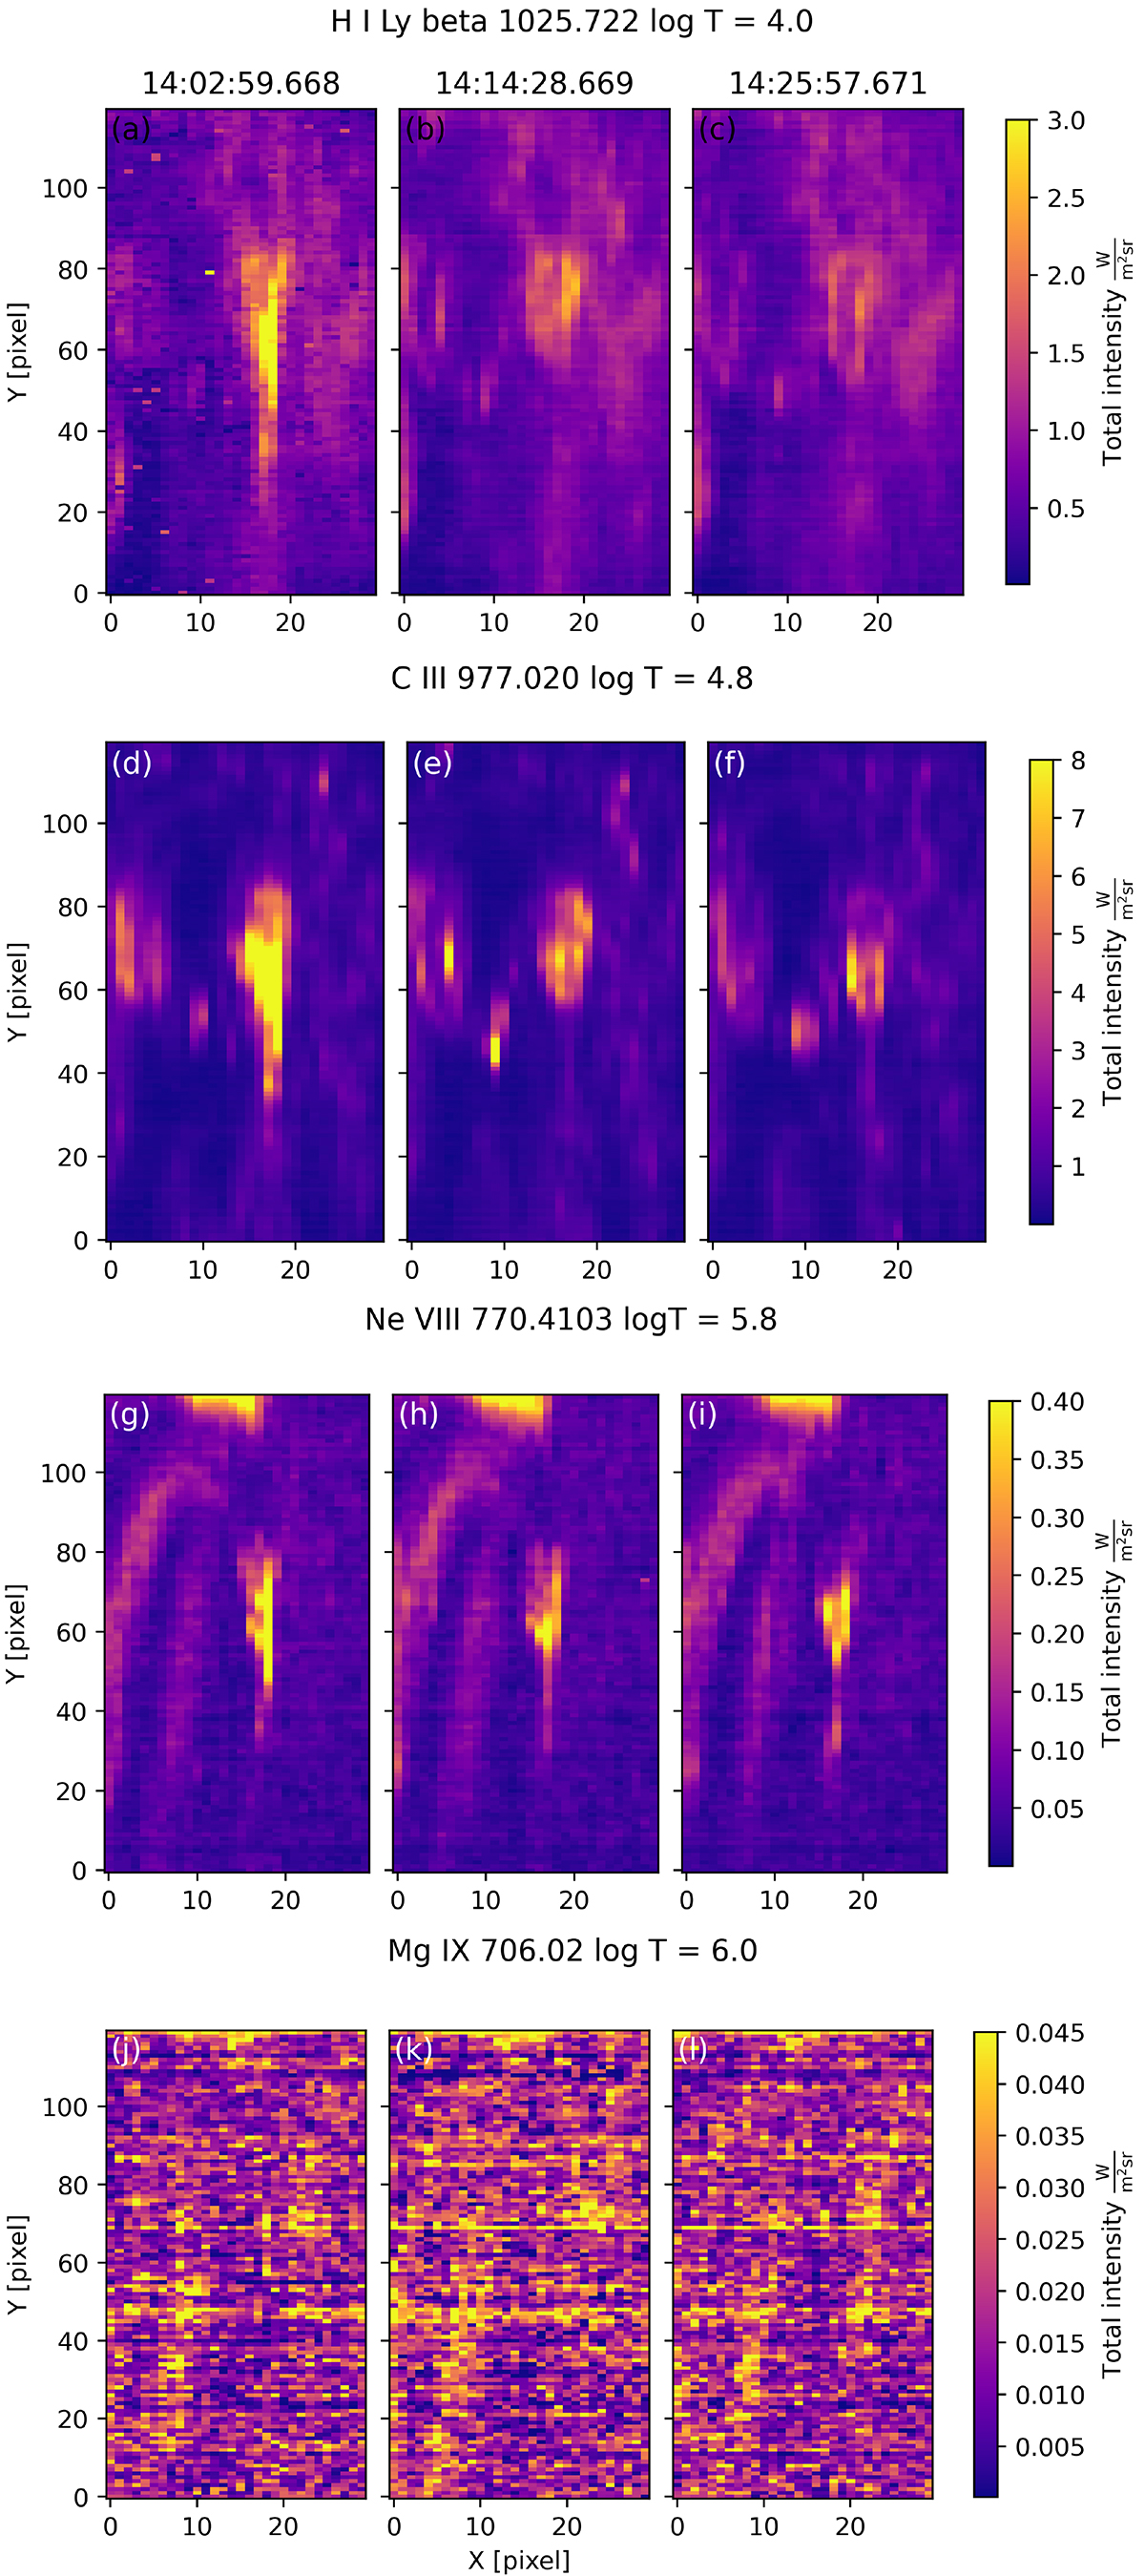
Intensity maps obtained with SPICE for four different lines starting from the cool chromosphere and incrementally increasing up to the coronal temperatures. The first row shows three consecutive frames (14:02:59, 14:14:28, and 14:25:57) for the H I Lyβ line, the second row shows intensity maps for the C III line, and the two last rows show intensity maps for the Ne VIII and Mg IX lines, correspondingly.
Current usage metrics show cumulative count of Article Views (full-text article views including HTML views, PDF and ePub downloads, according to the available data) and Abstracts Views on Vision4Press platform.
Data correspond to usage on the plateform after 2015. The current usage metrics is available 48-96 hours after online publication and is updated daily on week days.
Initial download of the metrics may take a while.