Fig. 5.
Download original image
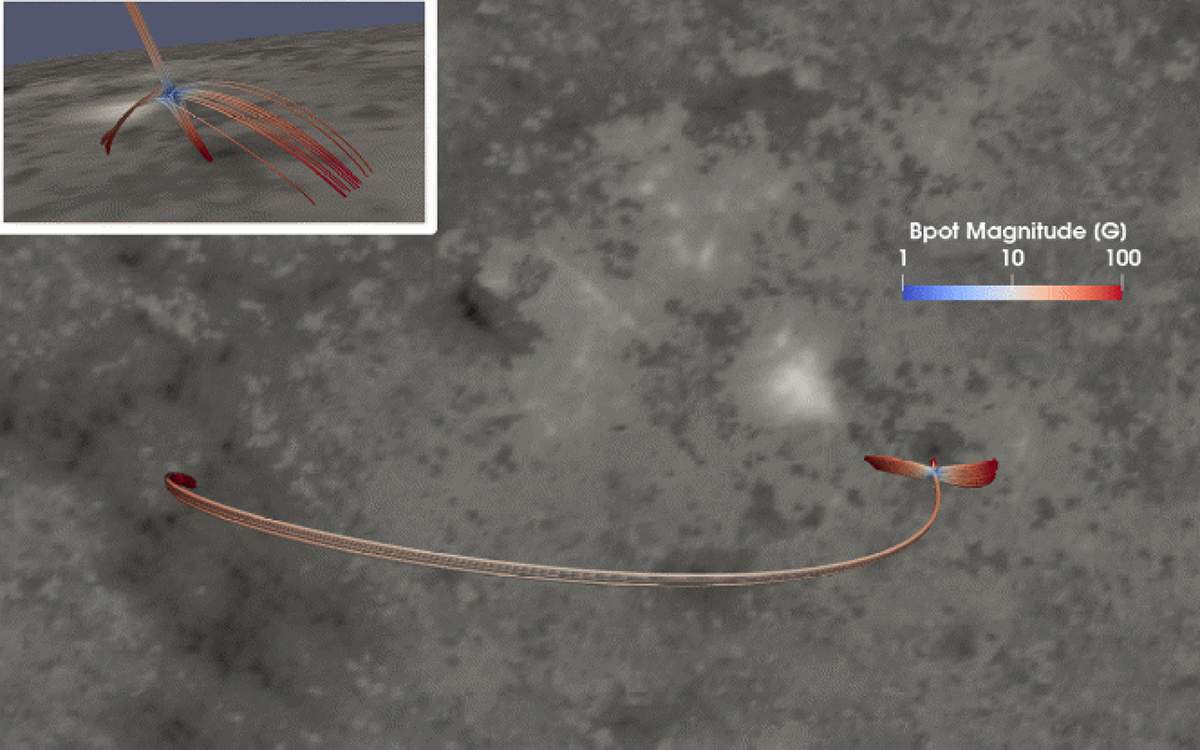
Field line rendering of the potential field in the vicinity of the null point. The background image represents the radial magnetic field saturated between −800 and 800 G; field lines are colored with the potential field magnitude, in logarithmic scale. The top-left inset shows an enlarged side-view of the null region.
Current usage metrics show cumulative count of Article Views (full-text article views including HTML views, PDF and ePub downloads, according to the available data) and Abstracts Views on Vision4Press platform.
Data correspond to usage on the plateform after 2015. The current usage metrics is available 48-96 hours after online publication and is updated daily on week days.
Initial download of the metrics may take a while.