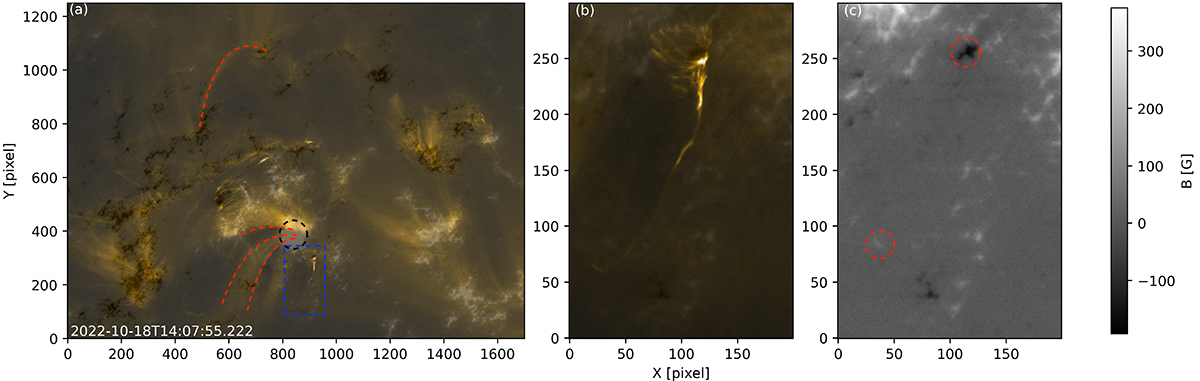
Fig. 3.
Download original image
Magnetograms obtained with PHI HRT. Panel a shows the cropped FoV of HRIEUV imposed on top of the HRT view. The blue rectangle shows the location of the spine. Red dashed curves show identified loops used for alignment purposes. The black dashed circle shows a sunspot near the spine. Panel b shows a zoomed-in view of the feature. Panel c shows a PHI zoomed-in view alone. Red dashed circles show the footpoint at the origin of the spine and the footpoint corresponding to the remote brightening.
Current usage metrics show cumulative count of Article Views (full-text article views including HTML views, PDF and ePub downloads, according to the available data) and Abstracts Views on Vision4Press platform.
Data correspond to usage on the plateform after 2015. The current usage metrics is available 48-96 hours after online publication and is updated daily on week days.
Initial download of the metrics may take a while.