Fig. B.3.
Download original image
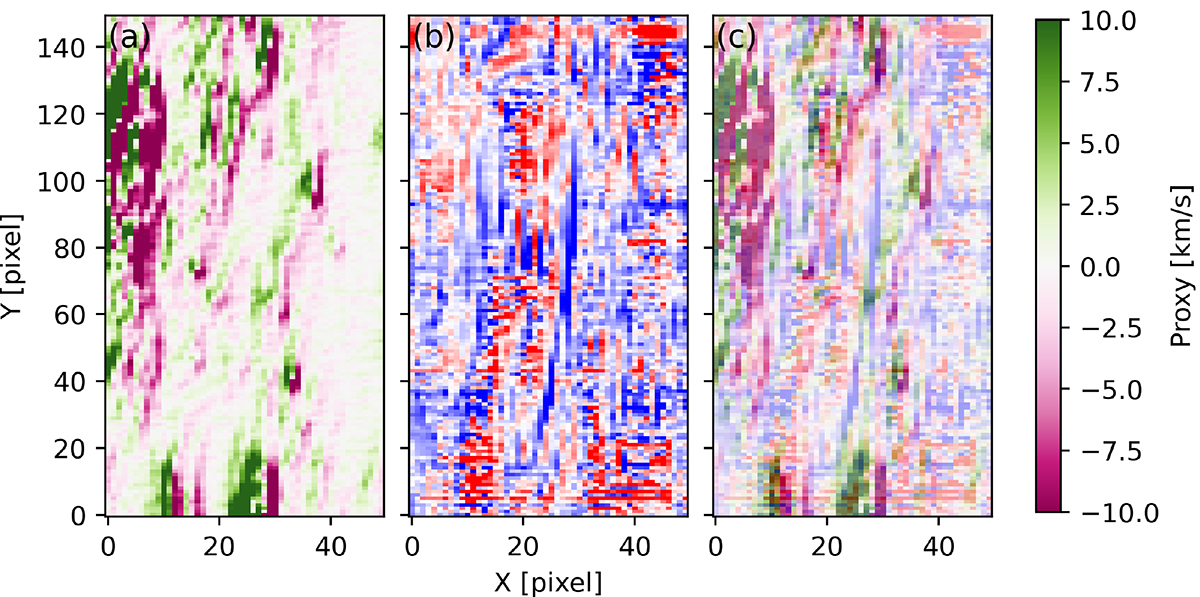
Simulated Doppler velocity maps representing a proxy for the effect of SPICE PSF tilt on velocities (panel (a)). Panel (b) shows the Doppler velocities obtained with SPICE for comparison. Panel (c) shows simulated velocity maps on top of Doppler maps obtained with SPICE.
Current usage metrics show cumulative count of Article Views (full-text article views including HTML views, PDF and ePub downloads, according to the available data) and Abstracts Views on Vision4Press platform.
Data correspond to usage on the plateform after 2015. The current usage metrics is available 48-96 hours after online publication and is updated daily on week days.
Initial download of the metrics may take a while.