Fig. 12.
Download original image
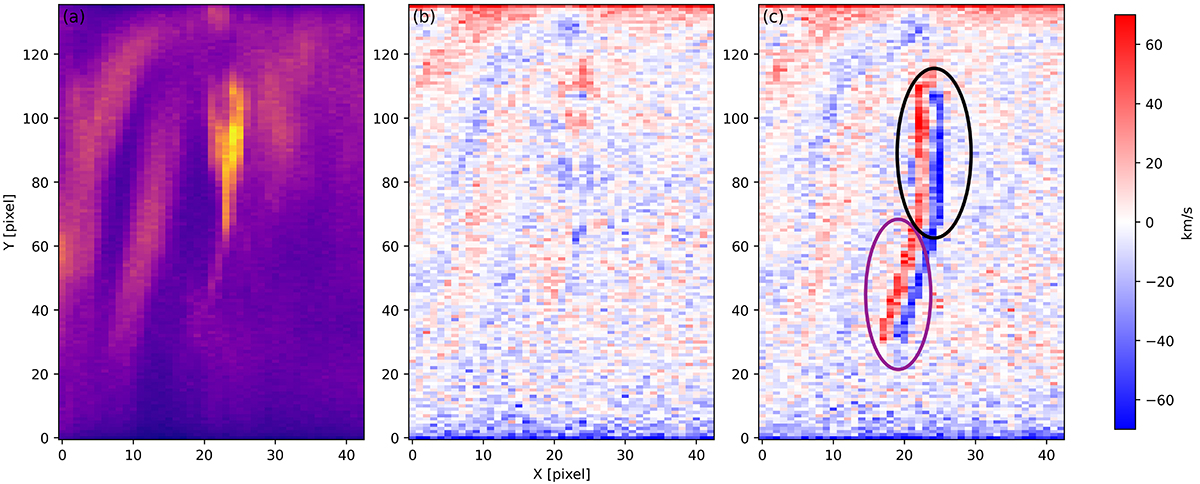
Synthesized spectral rasters obtained using forward-modeled analysis. Panel a shows the synthesized intensity, while the panels b and c show the Doppler maps (mimicking the SPICE CIII line) with and without local velocities imposed on top of the feature. The black ellipse in panel c shows the location of a strong signal that corresponds to the high intensity gradient. The magenta ellipse outlines the location that does not correspond to any intensity gradient.
Current usage metrics show cumulative count of Article Views (full-text article views including HTML views, PDF and ePub downloads, according to the available data) and Abstracts Views on Vision4Press platform.
Data correspond to usage on the plateform after 2015. The current usage metrics is available 48-96 hours after online publication and is updated daily on week days.
Initial download of the metrics may take a while.