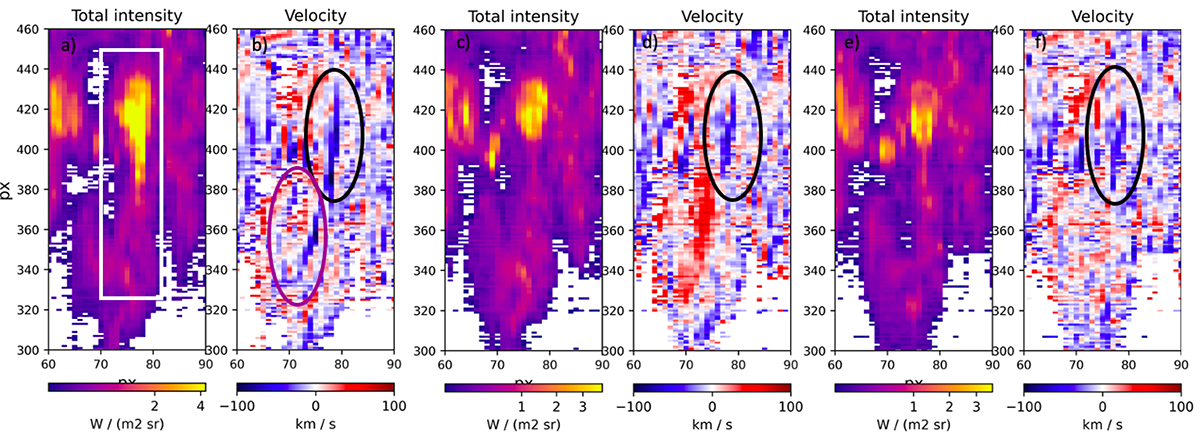
Fig. 11.
Download original image
Intensity and Doppler maps obtained with the SPICE C III line for three time frames (14:02:59, 14:14:28, and 14:25:57). Panels a and b show maps for the first time frame, panels c and d are for the second, and panels e and f are for the last frame. The white rectangle in panel a shows the location of the spine. Black ellipses in panels b, d, and f show the location of a strong signal that matches the high intensity gradient in panel a. The magenta ellipse in panel b shows the location of a strong Doppler signal that does not correspond to the high intensity gradient.
Current usage metrics show cumulative count of Article Views (full-text article views including HTML views, PDF and ePub downloads, according to the available data) and Abstracts Views on Vision4Press platform.
Data correspond to usage on the plateform after 2015. The current usage metrics is available 48-96 hours after online publication and is updated daily on week days.
Initial download of the metrics may take a while.