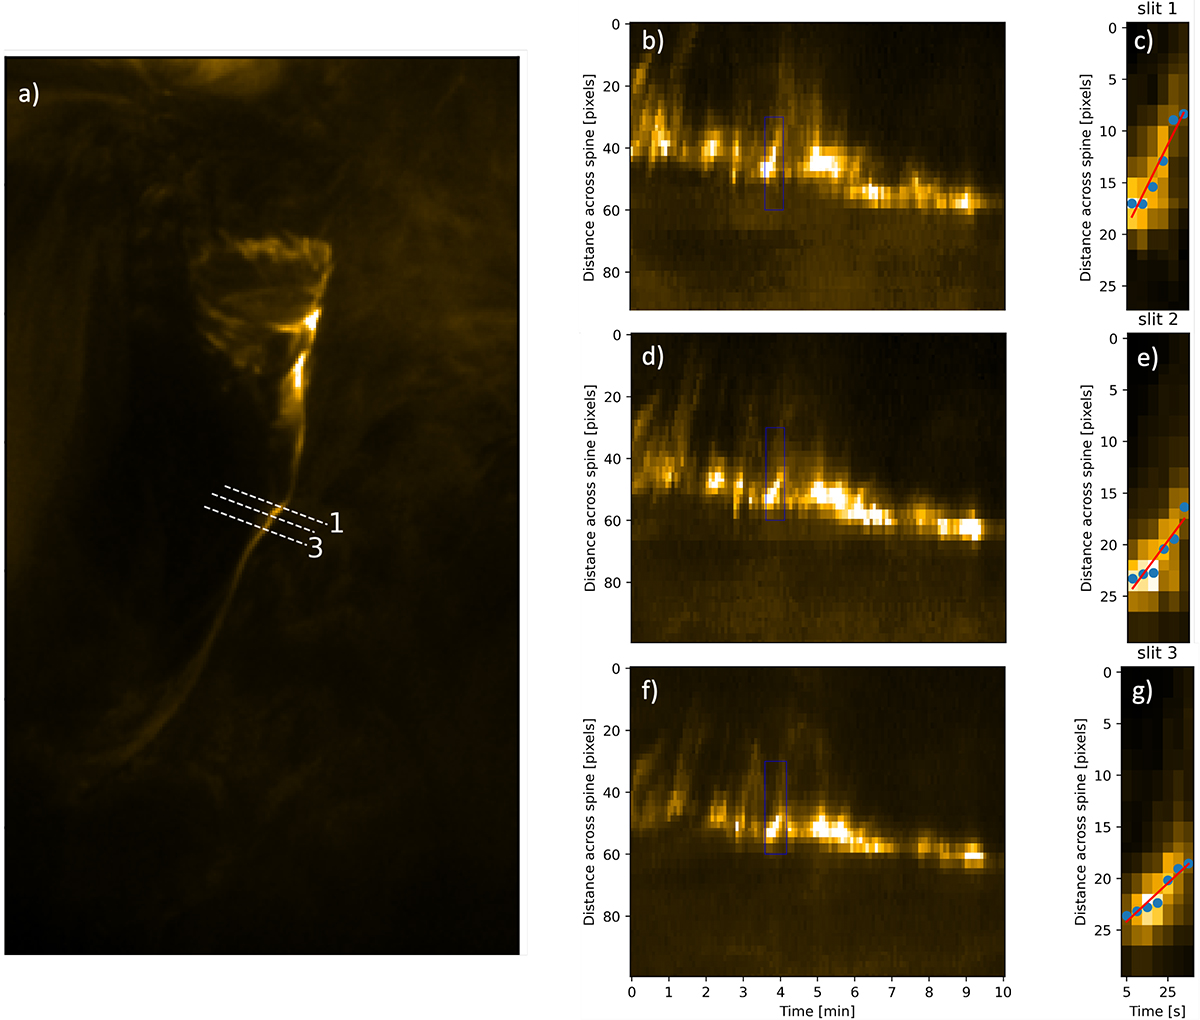
Fig. 10.
Download original image
Time-distance maps demonstrating the transverse motion. Slits used to construct time-distance maps are shown by white dashed lines (left column). Numbers denote the number of each slit. Time-distance maps were constructed from the slits taken across the spine (middle column) to show the evidence of the movement in the transverse direction. The third column shows a zoomed-in view with the points fitted to the propagating pulse. The zoomed-in view is indicated by a blue rectangle in each figure in the middle column.
Current usage metrics show cumulative count of Article Views (full-text article views including HTML views, PDF and ePub downloads, according to the available data) and Abstracts Views on Vision4Press platform.
Data correspond to usage on the plateform after 2015. The current usage metrics is available 48-96 hours after online publication and is updated daily on week days.
Initial download of the metrics may take a while.