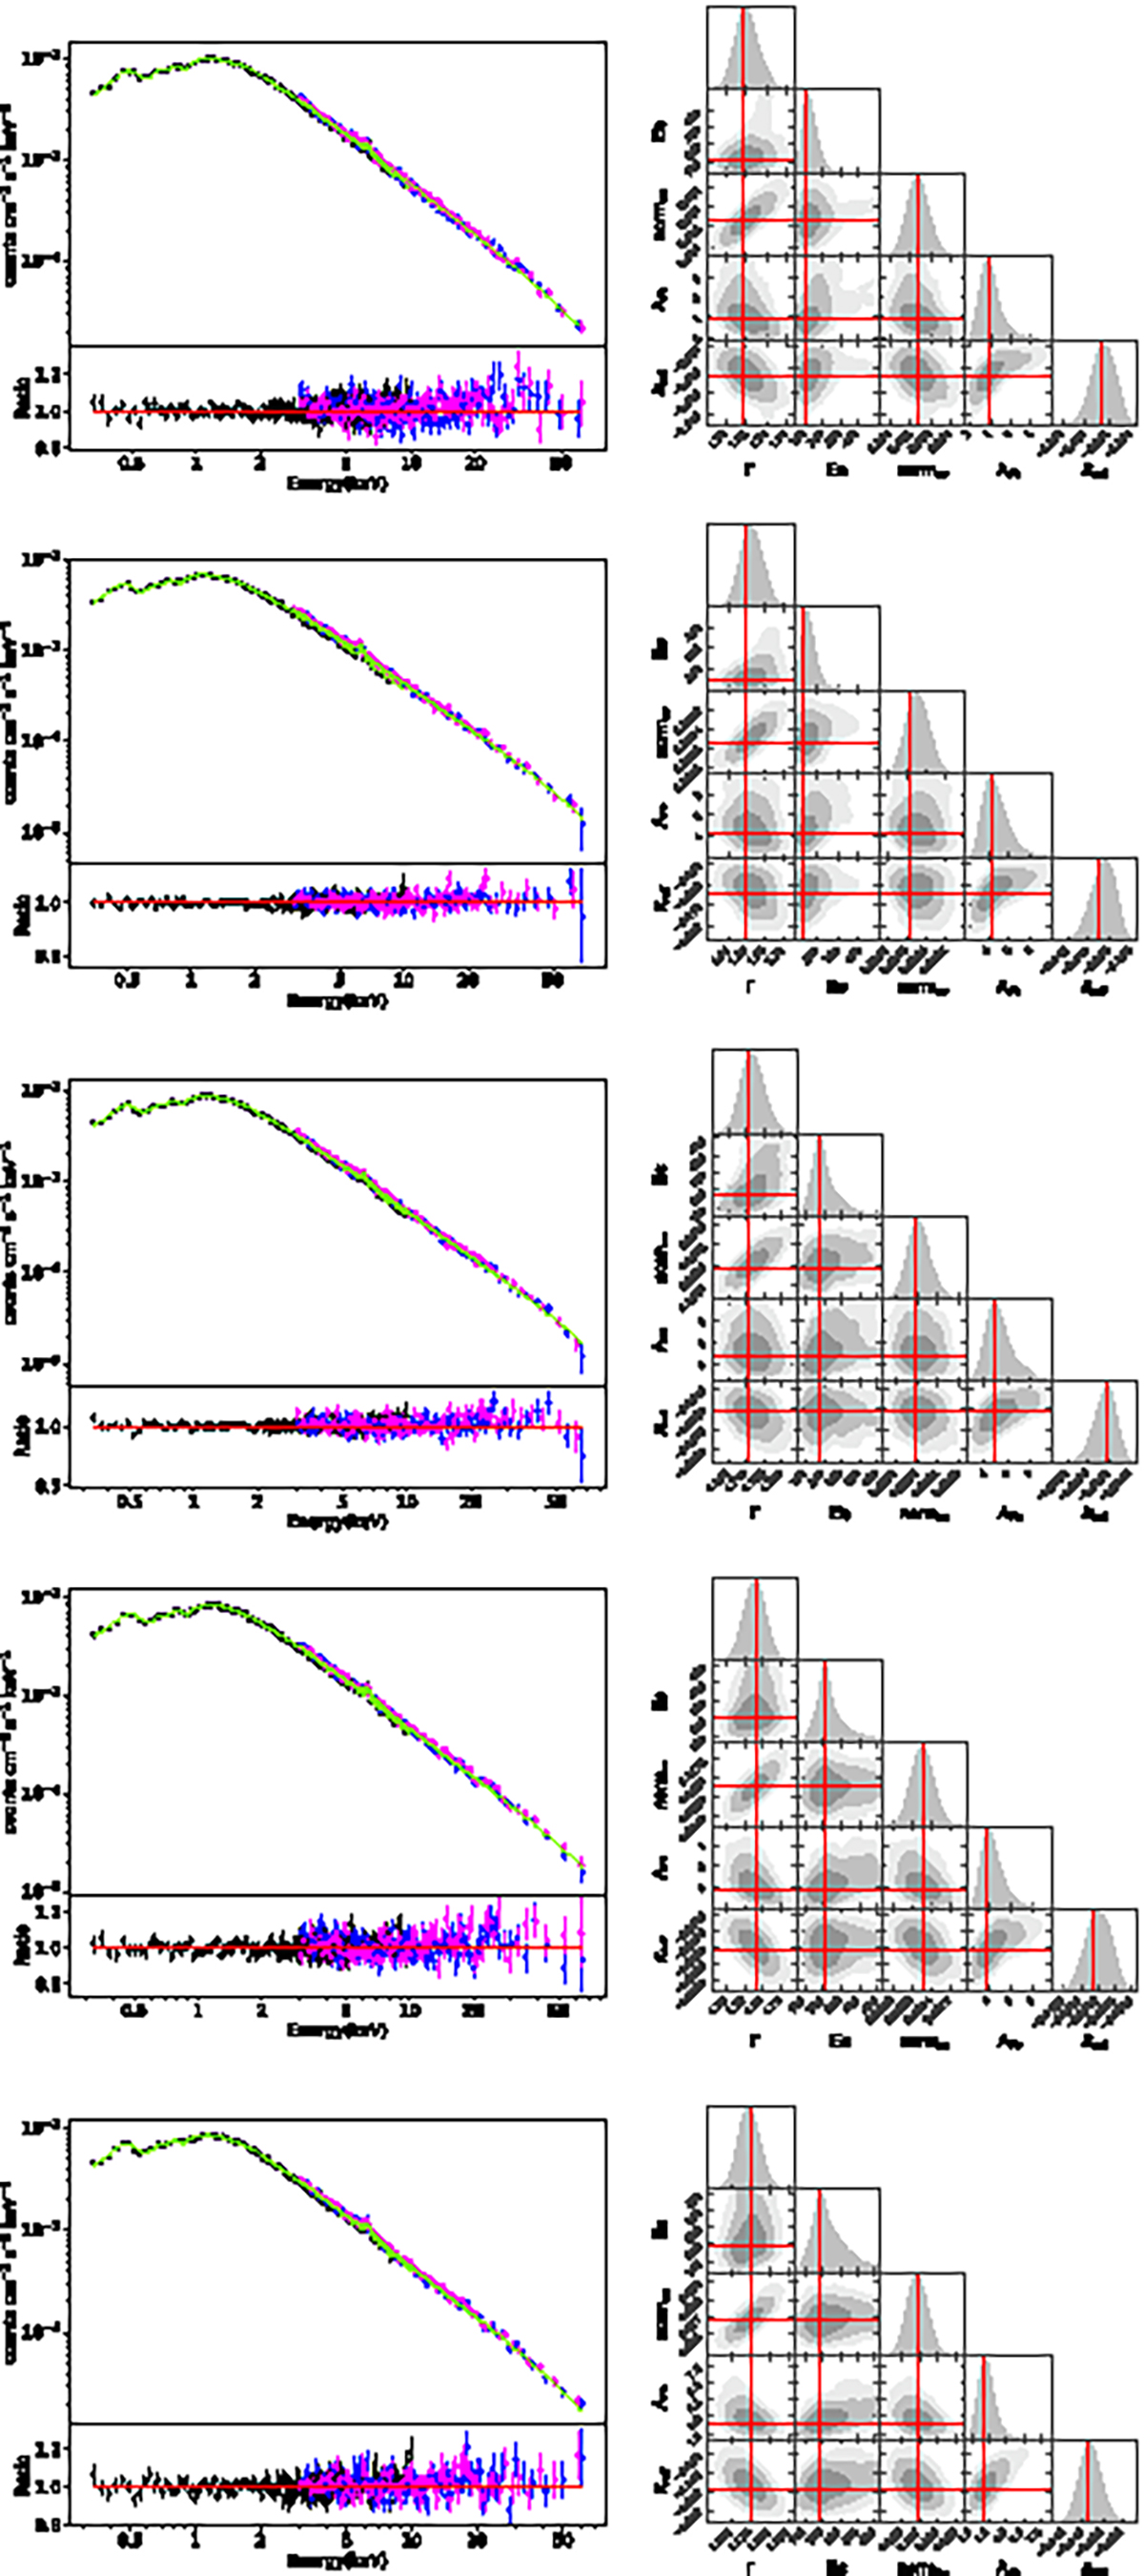
Fig. 9.
Download original image
Left panels: data, fitting model, and residual ratio for XMM-Newton EPIC-pn (black) and NuSTAR FPMA (blue) and FPMB (magenta) spectra of the simultaneous observations of IC 4329A when Model A (see Sect. 4.3) is applied to the data. Right panels: Contour plots at 68%, 90%, and 99% resulting from the MCMC analysis of Model A applied to the broadband XMM-Newton and NuSTAR 0.3–75 keV spectra of IC 4329A. We show the outputs for the photon index (Γ), cutoff energy (Ecut [keV]), NuSTAR normalization (normnu [ph keV−1 cm−2 s−1]), iron abundance (AFe), and reflection fraction (Rrefl). We report from top to bottom the Obs.IDs 086209101+60702050002, 086209103+60702050004, 086209105+60702050006, 086209107+60702050008, and 086209109+60702050010.
Current usage metrics show cumulative count of Article Views (full-text article views including HTML views, PDF and ePub downloads, according to the available data) and Abstracts Views on Vision4Press platform.
Data correspond to usage on the plateform after 2015. The current usage metrics is available 48-96 hours after online publication and is updated daily on week days.
Initial download of the metrics may take a while.