Open Access
Fig. 4.
Download original image
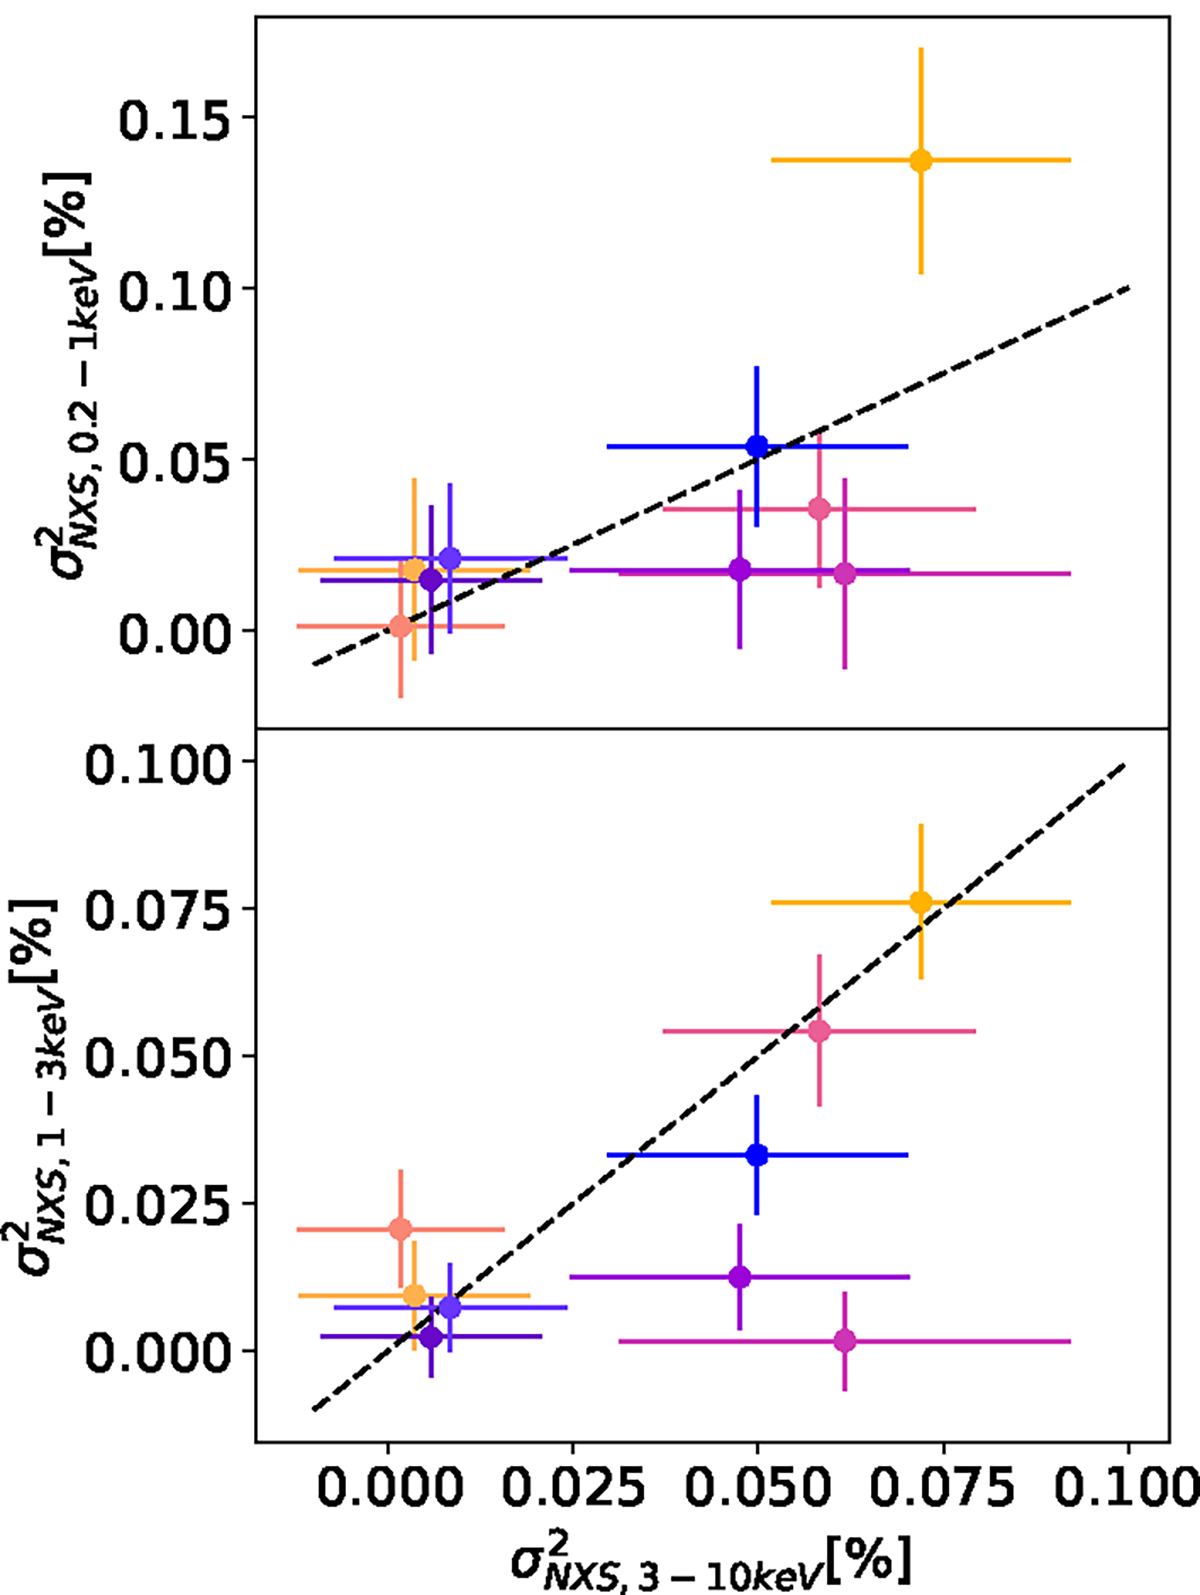
Top panel: soft (0.2–1 keV) vs. hard (3–10 keV) ![]() . Bottom panel: medium (1–3 keV) vs. hard (3–10 keV)
. Bottom panel: medium (1–3 keV) vs. hard (3–10 keV) ![]() . The values are calculated for the XMM-Newton EPIC-pn observations of IC 4329A as in Table 1. The dashed black lines represent the one-to-one relation. The color code for the different observations is the same as in Fig. 1.
. The values are calculated for the XMM-Newton EPIC-pn observations of IC 4329A as in Table 1. The dashed black lines represent the one-to-one relation. The color code for the different observations is the same as in Fig. 1.
Current usage metrics show cumulative count of Article Views (full-text article views including HTML views, PDF and ePub downloads, according to the available data) and Abstracts Views on Vision4Press platform.
Data correspond to usage on the plateform after 2015. The current usage metrics is available 48-96 hours after online publication and is updated daily on week days.
Initial download of the metrics may take a while.