Fig. 3.
Download original image
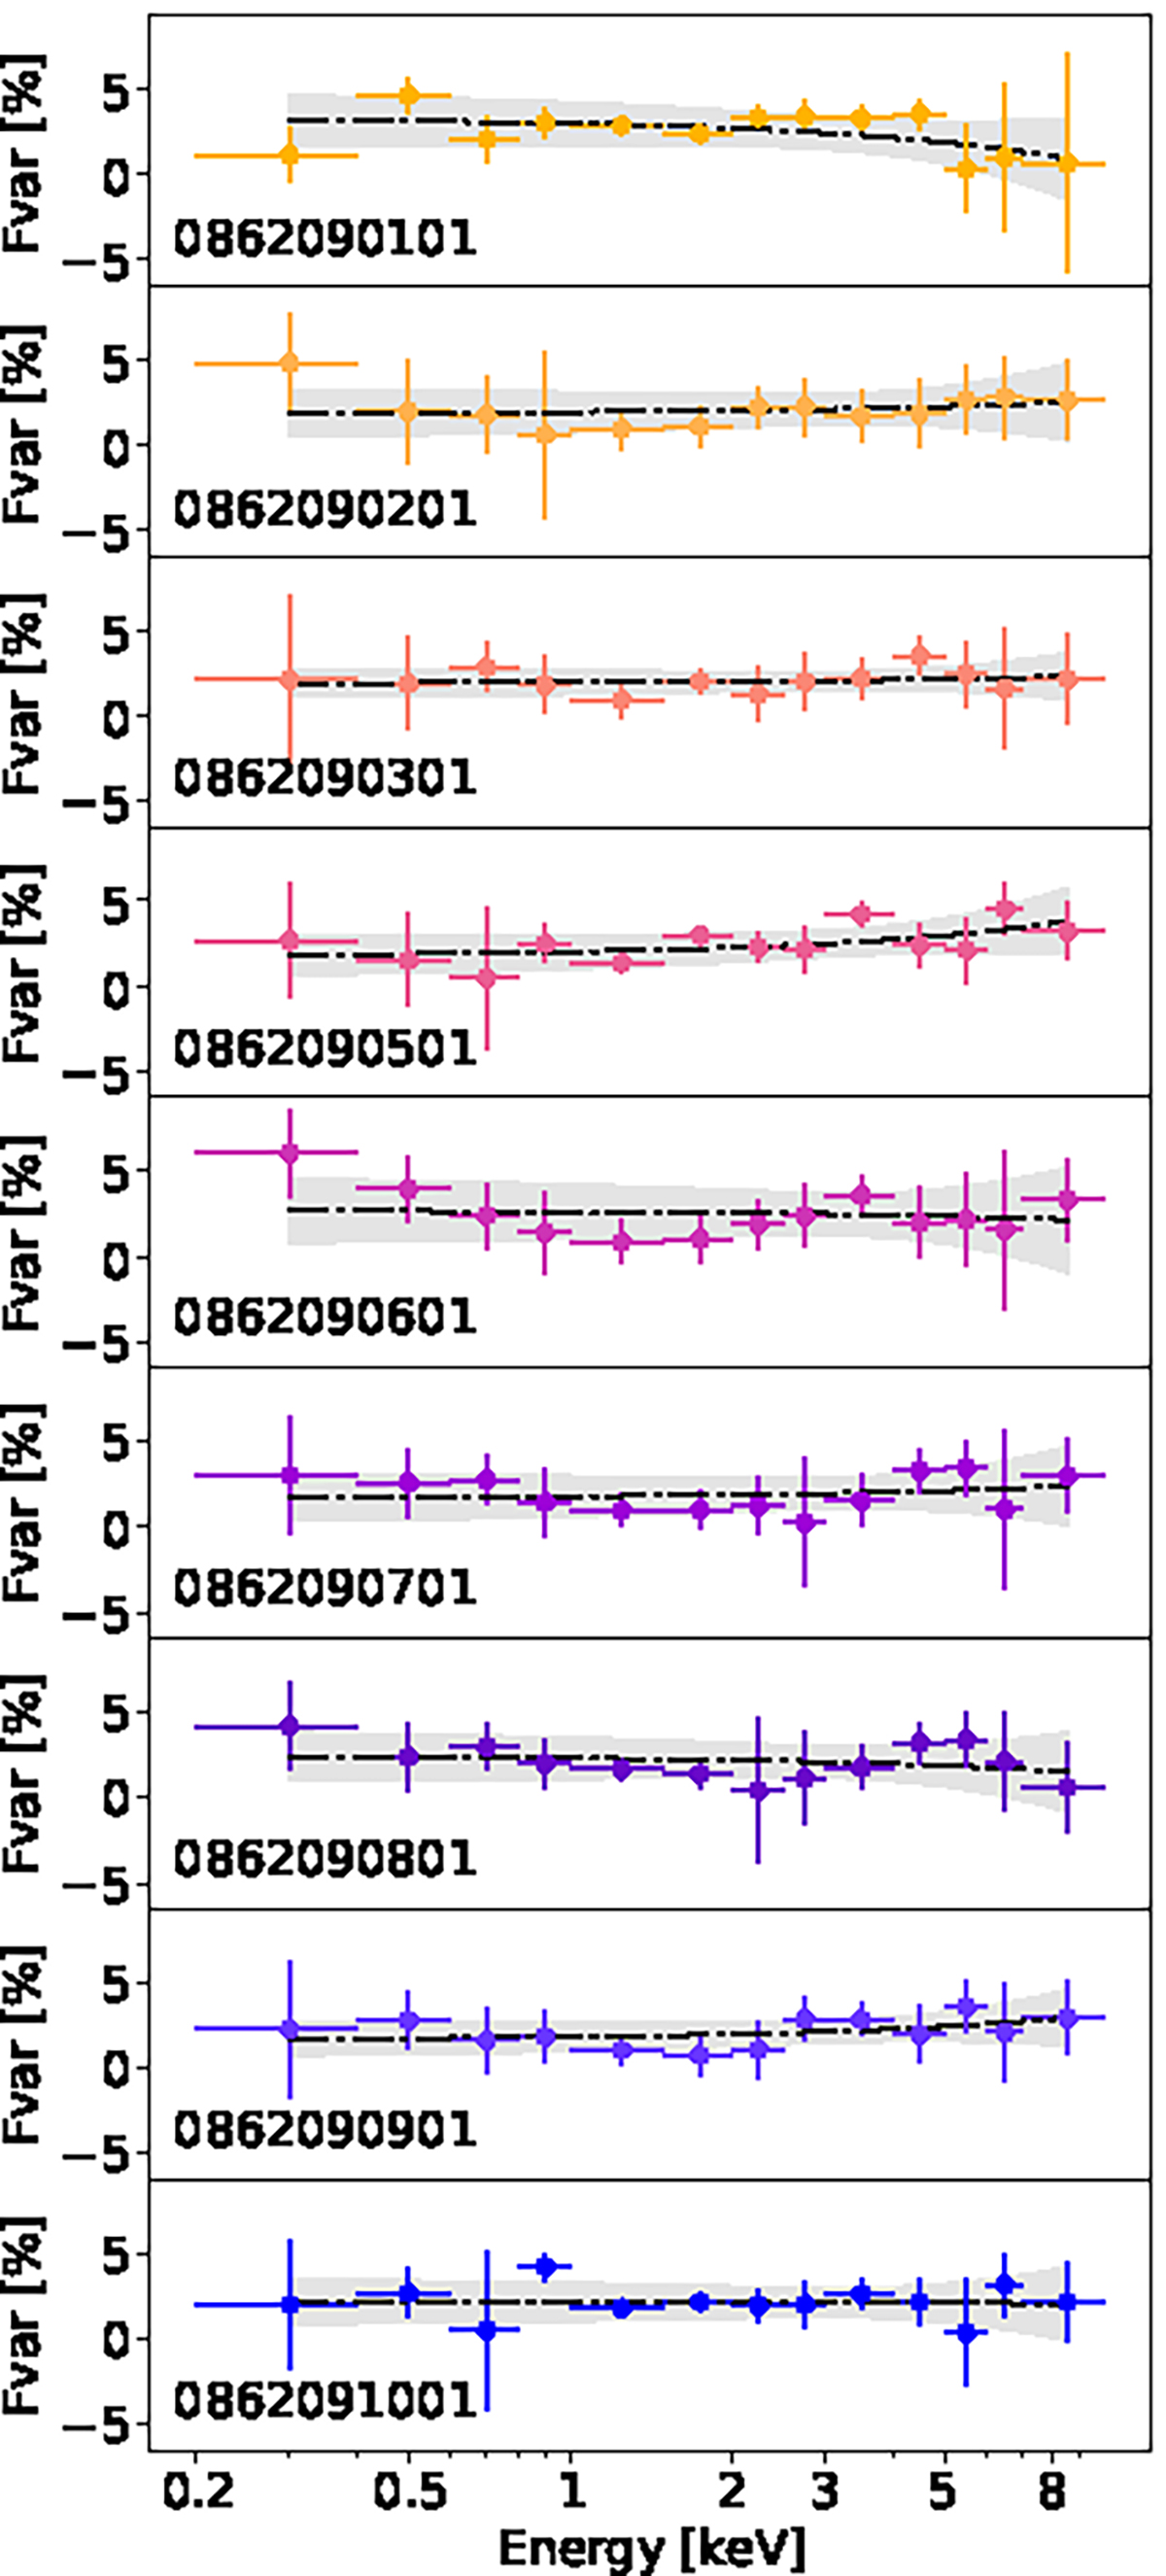
Fractional variability spectra for the XMM-Newton EPIC-pn observations of IC 4329A as in Table 1. The spectra of this campaign are characterized by a mostly flat shape, with a fractional variability that never exceeds 5%. The dot-dashed black lines are the linear regressions, and the shaded regions represent the combined 3σ error on the slope and normalization.
Current usage metrics show cumulative count of Article Views (full-text article views including HTML views, PDF and ePub downloads, according to the available data) and Abstracts Views on Vision4Press platform.
Data correspond to usage on the plateform after 2015. The current usage metrics is available 48-96 hours after online publication and is updated daily on week days.
Initial download of the metrics may take a while.