Fig. 12.
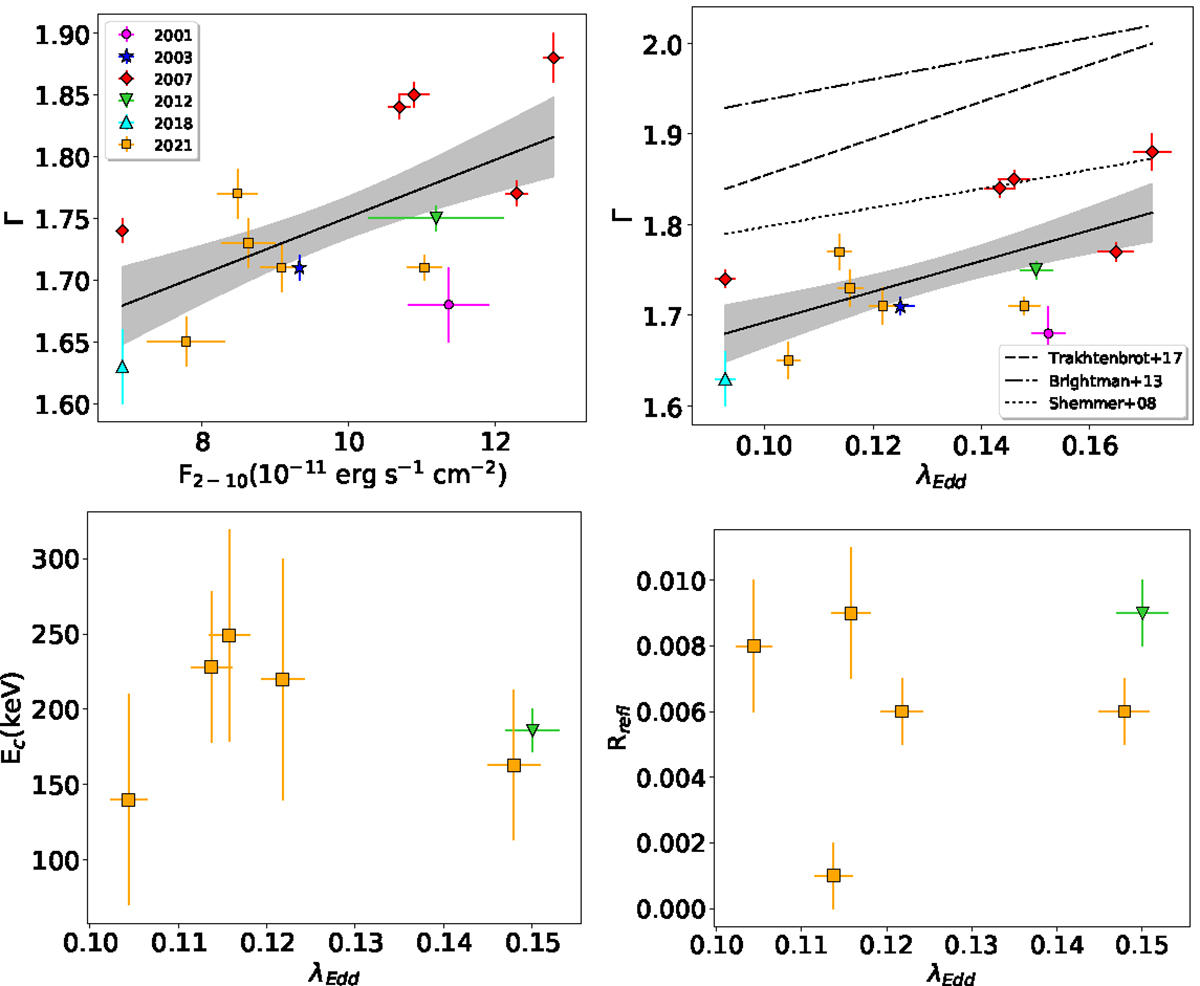
Download original image
Top panels: Γ vs. F2 − 10 keV (left) and Γ vs. λEdd (right) relation for IC 4329A. The black line shows the linear regression, and the shaded black regions represent the combined 1σ error on the slope and normalization. The dotted, dotted dashed, and dashed lines in the right panel represent the relations from Shemmer et al. (2008), Brightman et al. (2013) and Trakhtenbrot et al. (2017). Bottom left panel: Ec vs. λEdd. Bottom right panel: Rrefl vs. λEdd. The plots include the data from our campaign and the data obtained from archival XMM-Newton, NuSTAR and Suzaku observations. Ec and Rrefl cannot be measured when ony XMM-Newton data are available. The Eddington ratio was computed using the bolometric luminosity estimated using the bolometric correction to the 2–10 keV X-ray luminosity (κ2 − 10) from Lusso et al. (2010).
Current usage metrics show cumulative count of Article Views (full-text article views including HTML views, PDF and ePub downloads, according to the available data) and Abstracts Views on Vision4Press platform.
Data correspond to usage on the plateform after 2015. The current usage metrics is available 48-96 hours after online publication and is updated daily on week days.
Initial download of the metrics may take a while.