Fig. 11.
Download original image
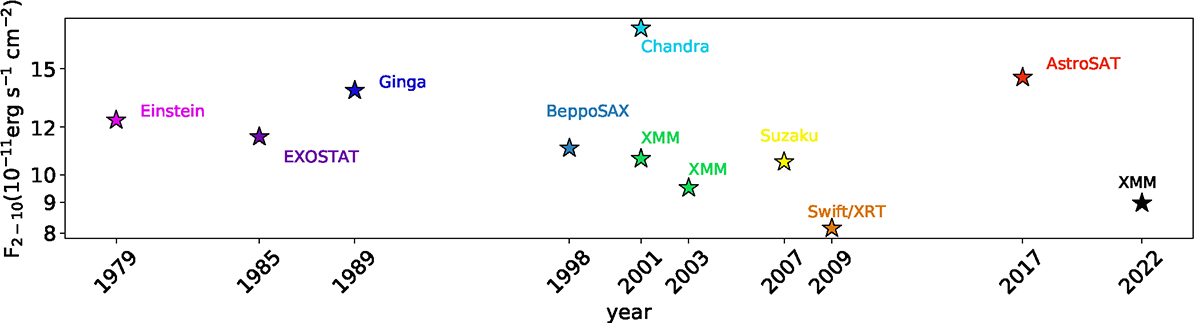
Historical 2–10 keV light curve of IC 4329A as observed with various X-ray satellites. In chronological order: Einstein, 1979 (Holt et al. 1989); EXOSAT, 1985 (Singh et al. 1991); Ginga, 1989 (Piro et al. 1990); BeppoSAX, 1998 (Dadina 2007); Chandra, 2001 (Shu et al. 2010); XMM-Newton 2001, 2003 (Nandra et al. 2007); Suzaku, 2007 (Mantovani et al. 2014); Swift/XRT, 2007 (Winter et al. 2009); AstroSat, 2017 (Tripathi et al. 2021); XMM-Newton 2022; medium flux of the observations analyzed in this work.
Current usage metrics show cumulative count of Article Views (full-text article views including HTML views, PDF and ePub downloads, according to the available data) and Abstracts Views on Vision4Press platform.
Data correspond to usage on the plateform after 2015. The current usage metrics is available 48-96 hours after online publication and is updated daily on week days.
Initial download of the metrics may take a while.