Open Access
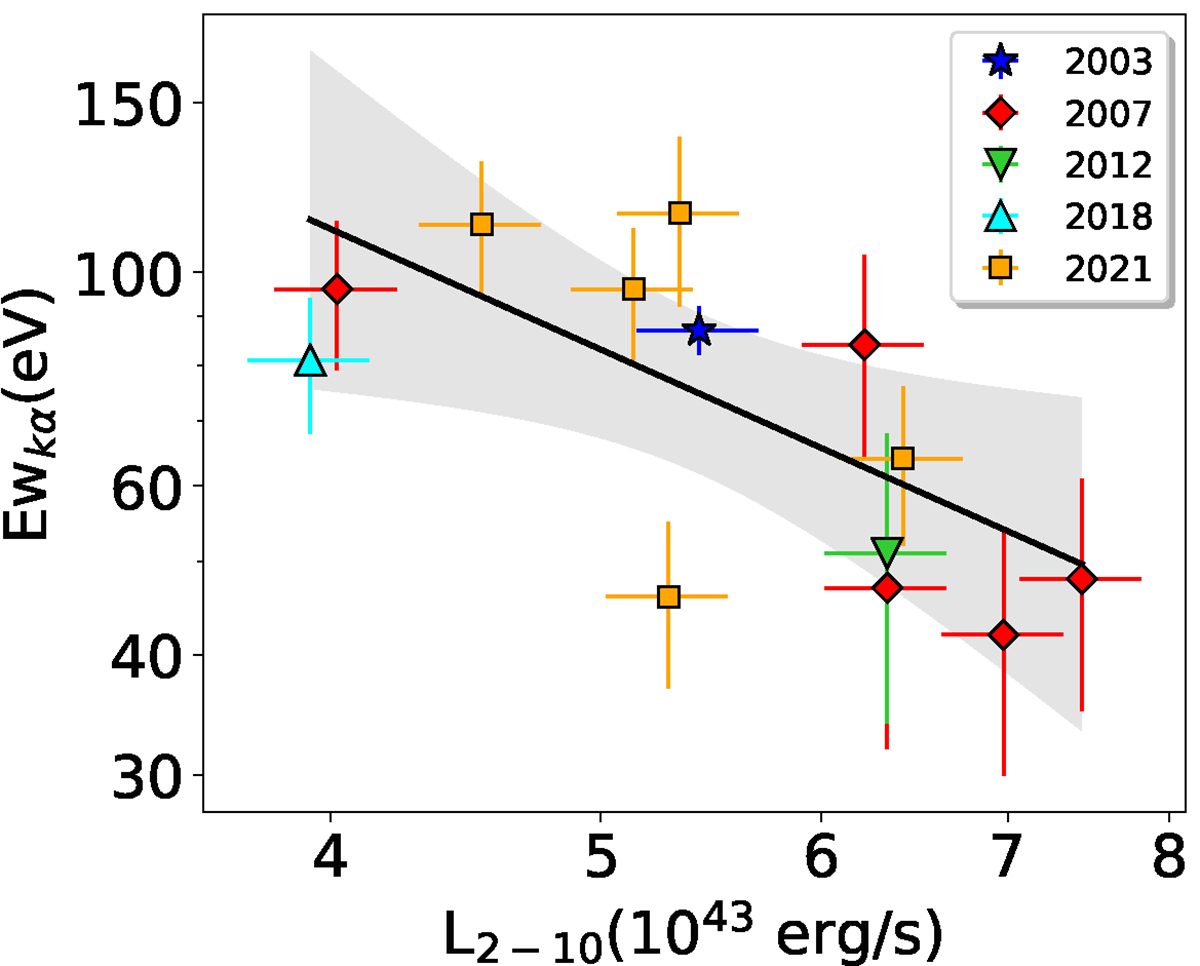
Fig. 10.
Download original image
Equivalent width (EWKα) of the neutral iron line plotted against the 2–10 keV X-ray luminosity (L2 − 10). The black line shows the linear regressions, and the shaded black regions represent the combined 3σ error on the slope and normalization.
Current usage metrics show cumulative count of Article Views (full-text article views including HTML views, PDF and ePub downloads, according to the available data) and Abstracts Views on Vision4Press platform.
Data correspond to usage on the plateform after 2015. The current usage metrics is available 48-96 hours after online publication and is updated daily on week days.
Initial download of the metrics may take a while.