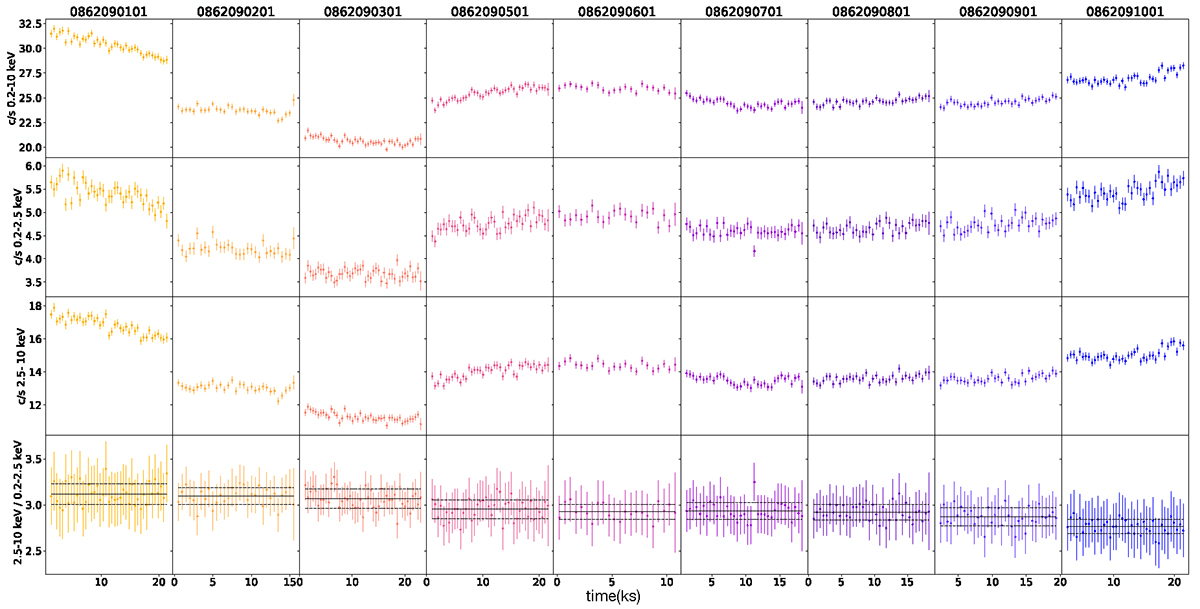
Fig. 1.
Download original image
XMM-Newton EPIC-pn light curves (background subtracted) in the 0.2–10 keV, 0.2–2.5 keV and in the 2.5–10 keV are shown in the top, top middle, and bottom middle panels, respectively. In the bottom panels, the ratios of the XMM-Newton EPIC-pn background-subtracted light curves in the 2.5–10 keV and 0.2–2.5 keV energy bands are reported. All the light curves are extracted using a binning time of 500 s. The solid and dashed black lines indicate the average and the standard error of the mean, respectively. The color code used in this figure for different ObsID is applied throughout the paper.
Current usage metrics show cumulative count of Article Views (full-text article views including HTML views, PDF and ePub downloads, according to the available data) and Abstracts Views on Vision4Press platform.
Data correspond to usage on the plateform after 2015. The current usage metrics is available 48-96 hours after online publication and is updated daily on week days.
Initial download of the metrics may take a while.