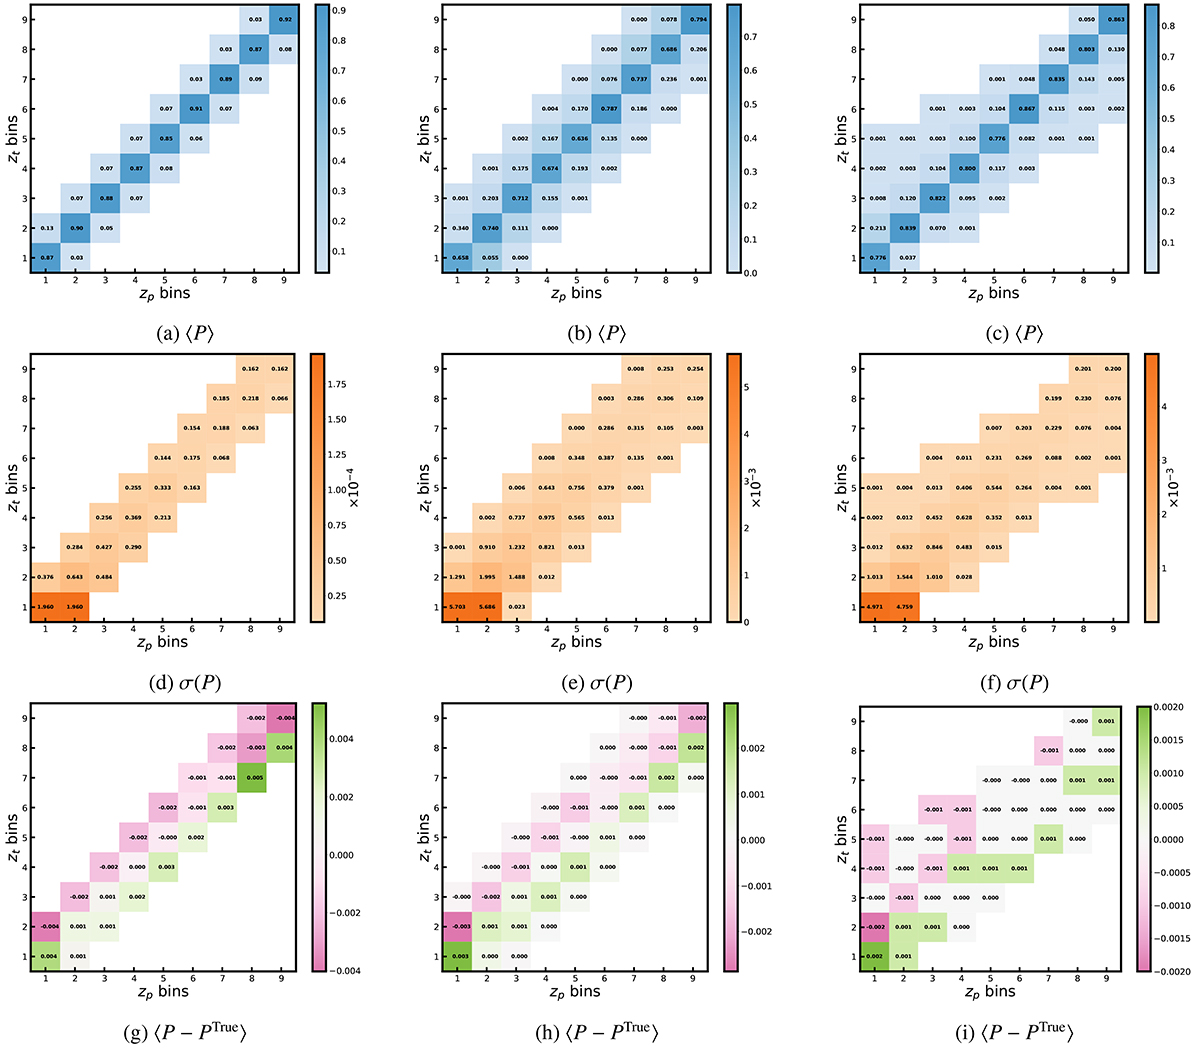
Fig. 5.
Download original image
Performance of the scattering matrix computed with the method described in Sect. 5. Top: average scattering matrix computed from 300 realisations. Middle: its standard deviation. Bottom: difference between the scattering matrix computed from our method and the true scattering matrix computed from simulated catalogues. Left column: scattering matrix computed for σ0 = 0.02. Middle column: scattering matrix computed for σ0 = 0.05. Right column: scattering matrix computed for γ0 = 0.02.
Current usage metrics show cumulative count of Article Views (full-text article views including HTML views, PDF and ePub downloads, according to the available data) and Abstracts Views on Vision4Press platform.
Data correspond to usage on the plateform after 2015. The current usage metrics is available 48-96 hours after online publication and is updated daily on week days.
Initial download of the metrics may take a while.