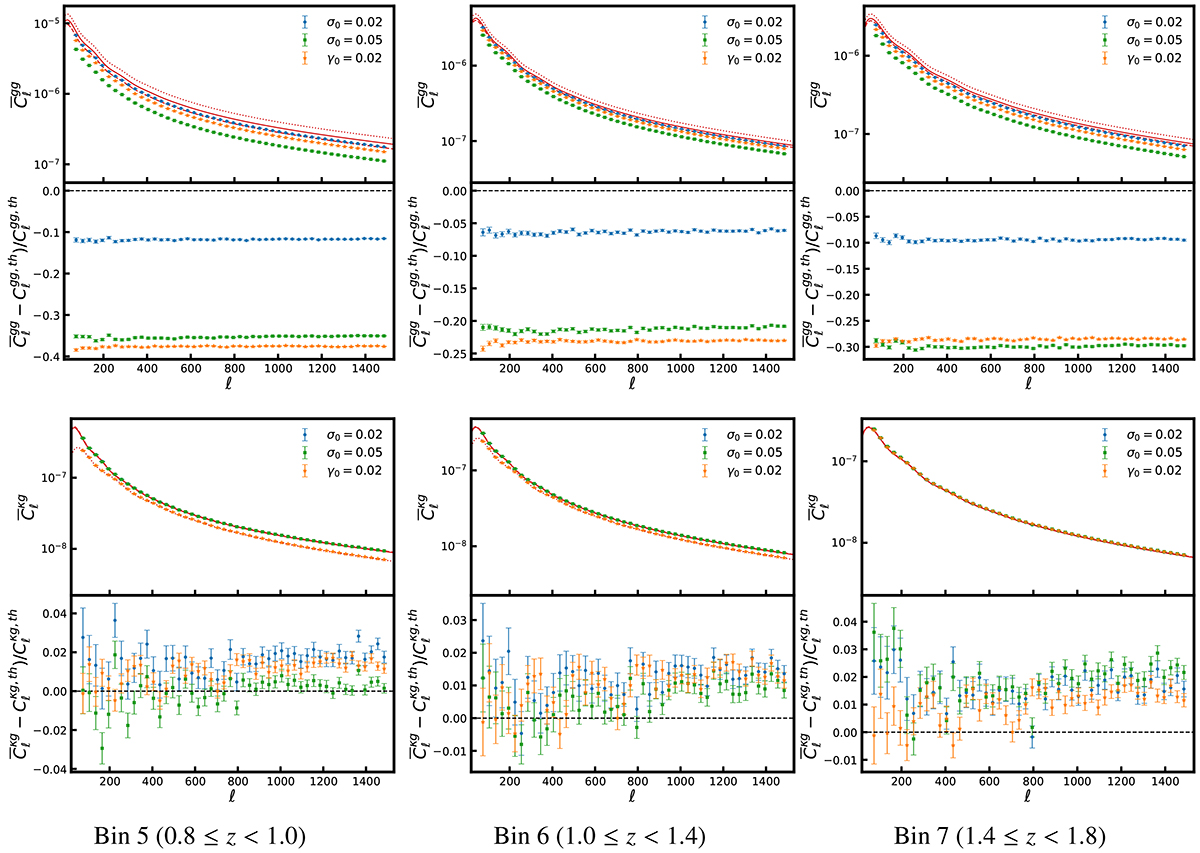
Fig. 4.
Download original image
Comparison of estimated power spectra for different photometric redshift errors. Top: average galaxy auto-power spectrum. Bottom: cross-power spectrum reconstructed from 300 realisations of photometric datasets for three tomographic bins. The blue, green, and orange symbols show the reconstructed power spectra for Case-I (σ0 = 0.02, σ0 = 0.05) and Case-II (γ0 = 0.02), respectively. The solid, dashed, and dotted red lines are the corresponding theoretical power spectra computed with redshift distributions estimated by the convolution method using Eq. (12). The error bars are computed from the covariance matrix of simulations using Eq. (9).
Current usage metrics show cumulative count of Article Views (full-text article views including HTML views, PDF and ePub downloads, according to the available data) and Abstracts Views on Vision4Press platform.
Data correspond to usage on the plateform after 2015. The current usage metrics is available 48-96 hours after online publication and is updated daily on week days.
Initial download of the metrics may take a while.