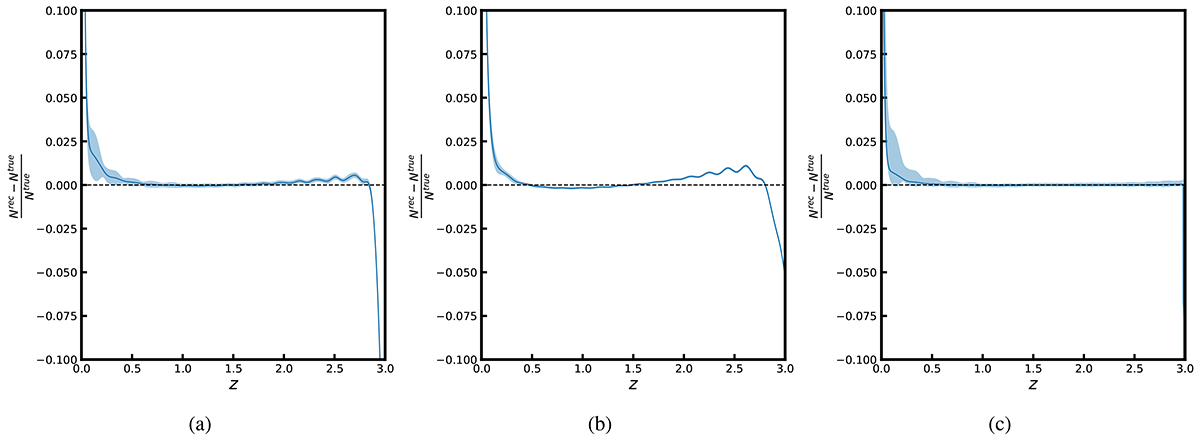
Fig. 3.
Download original image
Average relative difference between the redshift distributions reconstructed using the deconvolution method and the true distribution from 300 simulations for (a) Gaussian error distribution with σ0 = 0.02, (b) a Gaussian error distribution with σ0 = 0.05, and (c) a modified Lorentzian error distribution with γ0 = 0.02. The shaded region represents the 1σ deviations in reconstruction between 300 simulations.
Current usage metrics show cumulative count of Article Views (full-text article views including HTML views, PDF and ePub downloads, according to the available data) and Abstracts Views on Vision4Press platform.
Data correspond to usage on the plateform after 2015. The current usage metrics is available 48-96 hours after online publication and is updated daily on week days.
Initial download of the metrics may take a while.