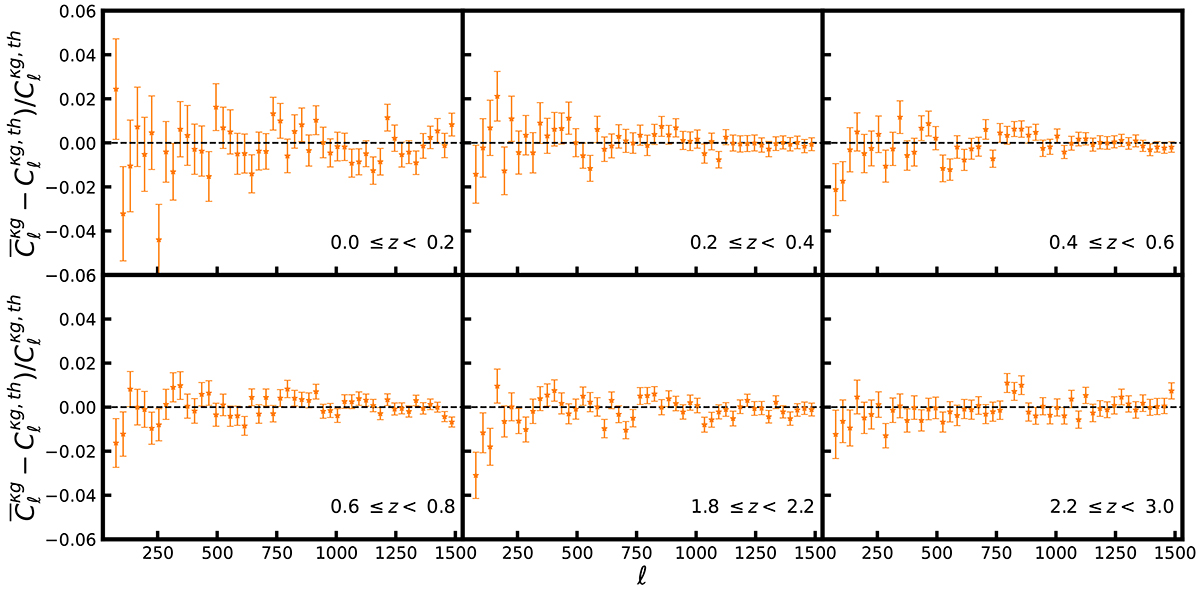
Fig. D.6.
Download original image
Average cross-power spectrum between galaxy over-density and CMB convergence reconstructed from 300 simulations of photometric datasets with a modified Lorentzian error distribution, shown for three tomographic bins computed through the scattering matrix (complementary to Fig. 8). The error bars are computed from the covariance matrix of simulations using Eq. (9).
Current usage metrics show cumulative count of Article Views (full-text article views including HTML views, PDF and ePub downloads, according to the available data) and Abstracts Views on Vision4Press platform.
Data correspond to usage on the plateform after 2015. The current usage metrics is available 48-96 hours after online publication and is updated daily on week days.
Initial download of the metrics may take a while.