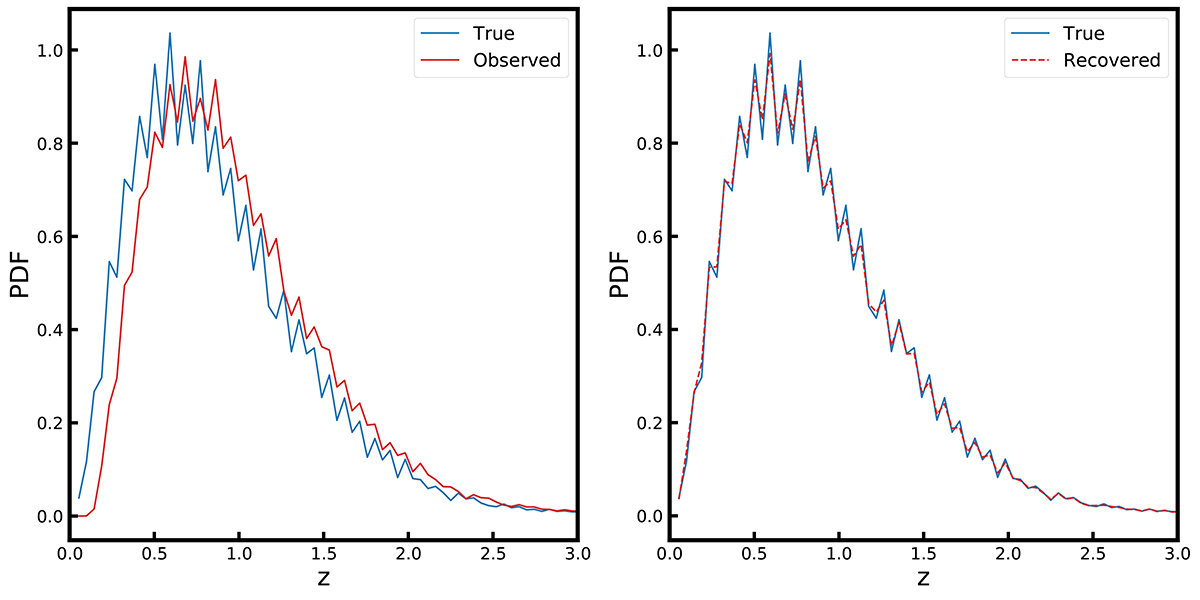
Fig. A.1.
Download original image
Performance of the deconvolution method for estimating the true redshift distribution. Left: True (solid blue line) and observed (solid red line) distributions for our toy example. Right: Comparison of the true redshift distribution (solid blue line) with the distribution recovered from the deconvolution method (dashed red line). The recovered distribution agrees excellently with the true redshift distribution.
Current usage metrics show cumulative count of Article Views (full-text article views including HTML views, PDF and ePub downloads, according to the available data) and Abstracts Views on Vision4Press platform.
Data correspond to usage on the plateform after 2015. The current usage metrics is available 48-96 hours after online publication and is updated daily on week days.
Initial download of the metrics may take a while.