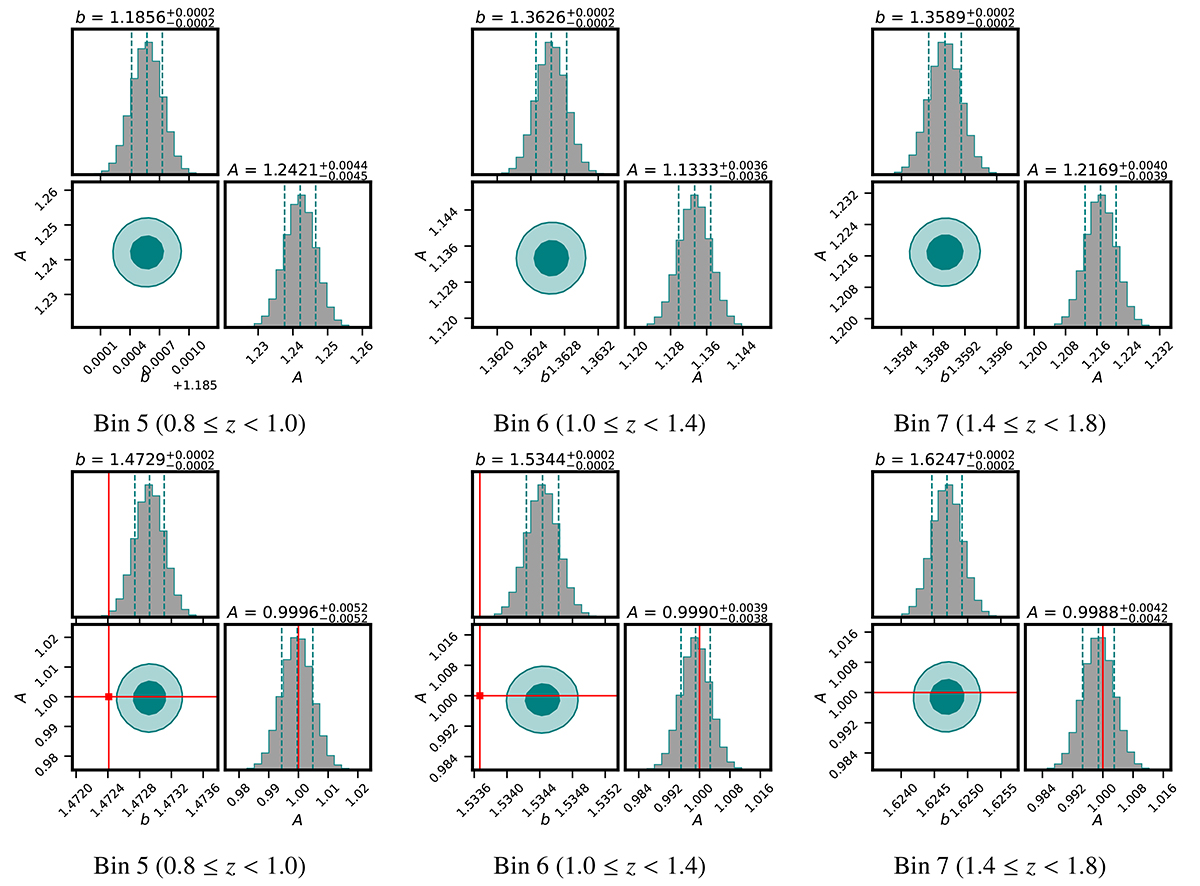
Fig. 10.
Download original image
Parameter posteriors obtained from the maximum likelihood estimation performed over the average power spectra from 300 simulations with σ0 = 0.05. The top and bottom panels show the posteriors before and after correction for leakage, respectively. The three vertical dashed lines are the median value of the posterior and ±1σ errors. The 68% and 95% confidence contours are shown in darker and lighter shades, respectively. The red lines are the true values of the parameters used for simulations.
Current usage metrics show cumulative count of Article Views (full-text article views including HTML views, PDF and ePub downloads, according to the available data) and Abstracts Views on Vision4Press platform.
Data correspond to usage on the plateform after 2015. The current usage metrics is available 48-96 hours after online publication and is updated daily on week days.
Initial download of the metrics may take a while.