Fig. A.1.
Download original image
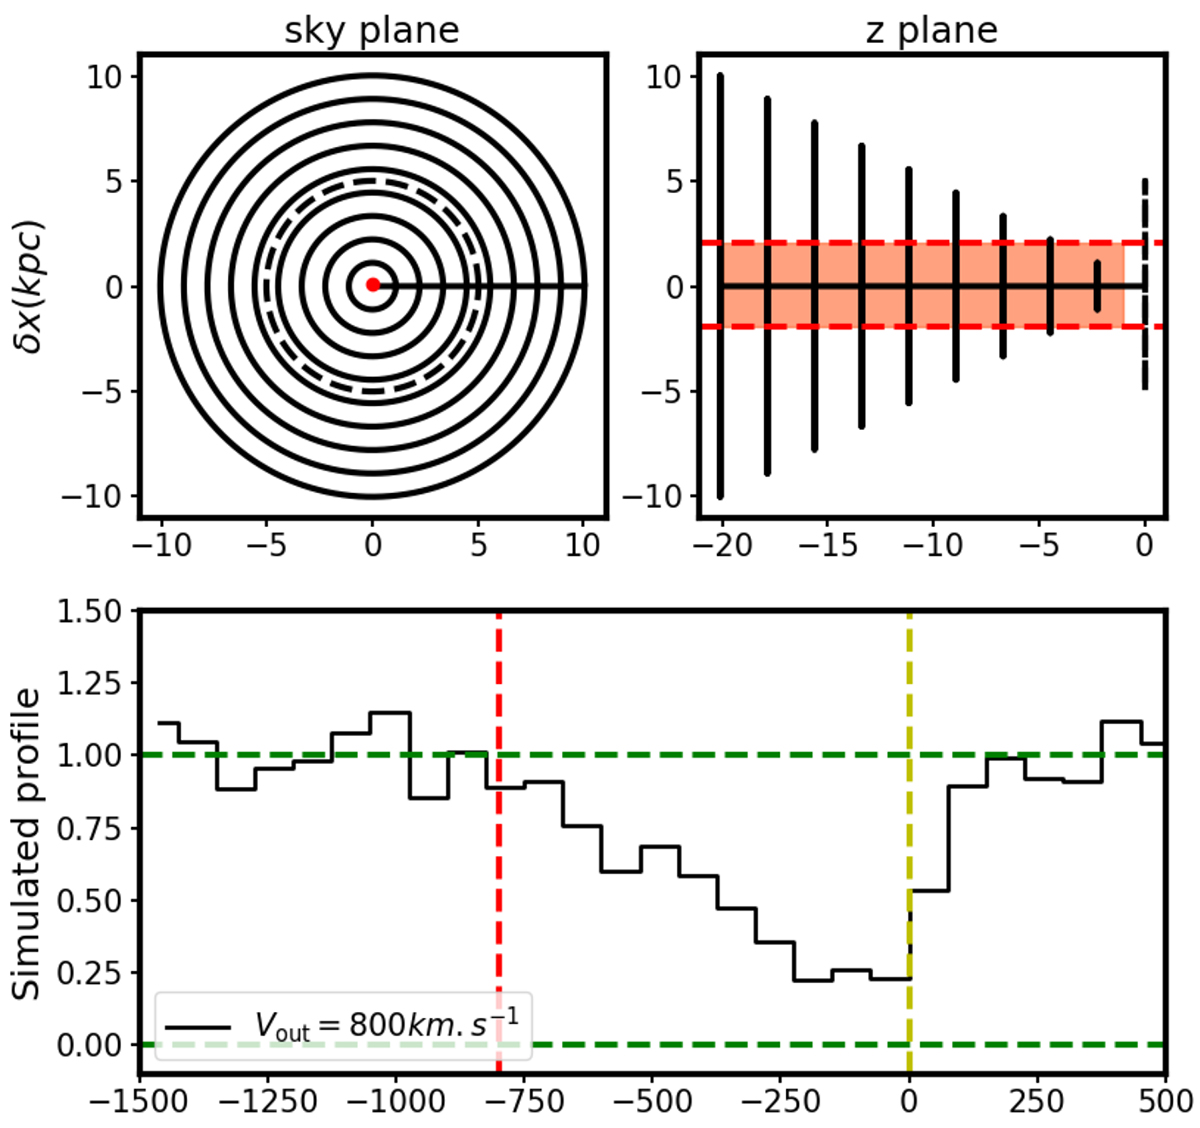
Wind model using a similar configuration to that used in H15. Top left: Sky plane representation of the system. The dashed black circle corresponds to the face-on galaxy. The black circles represent the outflowing cone and the red dot represents the center of the line of sight crossing the outflowing cone. Top right: Side view of the system. The galaxy is represented on the right as a dashed vertical line, the outflowing cone as the vertical black lines going to the left. The line of sight is represented by the red filled rectangle crossing the outflowing cone. Bottom: Resulting simulated absorption profile. The vertical red dashed line represents the outflow velocity used as input for this wind model. The simulated profile was convolved with the resolution used in H15 (∼75km s−1 FWHM).
Current usage metrics show cumulative count of Article Views (full-text article views including HTML views, PDF and ePub downloads, according to the available data) and Abstracts Views on Vision4Press platform.
Data correspond to usage on the plateform after 2015. The current usage metrics is available 48-96 hours after online publication and is updated daily on week days.
Initial download of the metrics may take a while.