Fig. 5.
Download original image
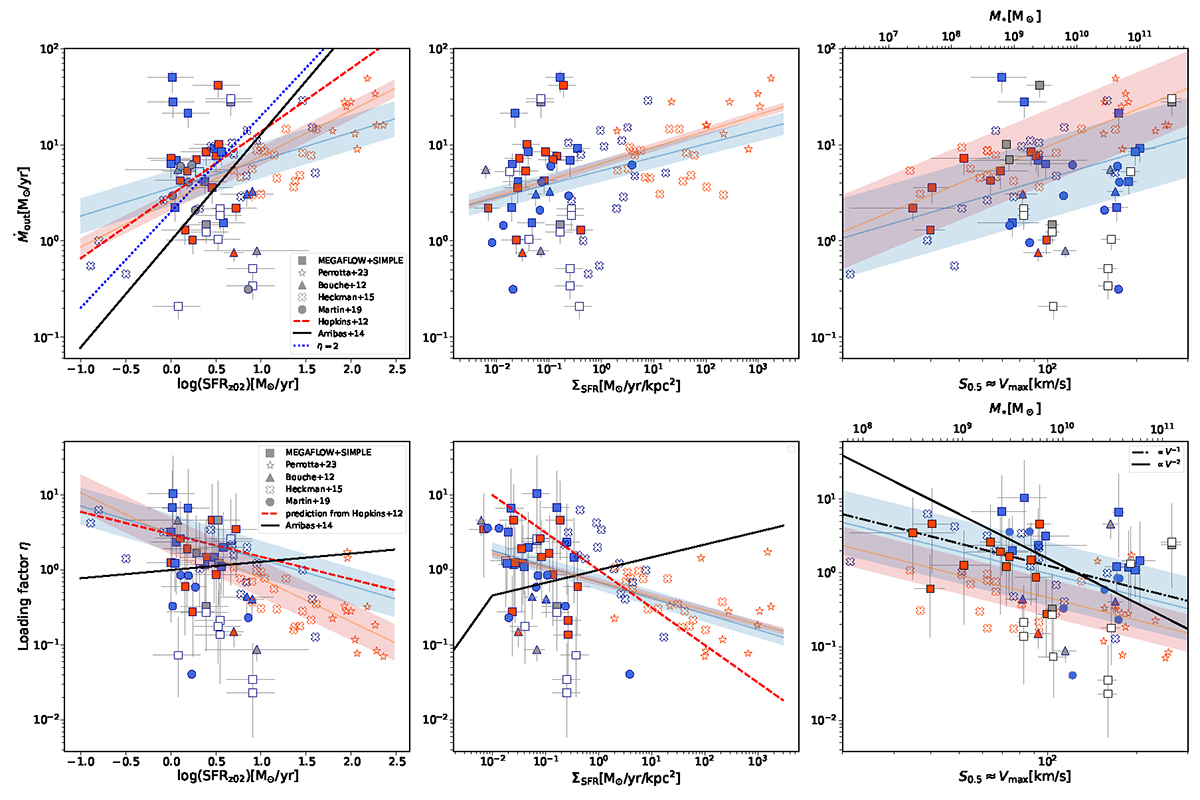
Mass ejection rate and loading factor as a function of galaxy properties. Top: mass ejection rate as a function of star formation rate (left), star formation rate surface density (ΣSFR, middle), and galaxy circular velocity (right, and stellar mass on top x-axis) for both surveys (MEGAFLOW and SIMPLE) as well as observations from B12, H15, M19, and P23. In the left panel, the dashed red line shows the prediction Ṁout ∝ SFR0.7 from Hopkins et al. (2012) and the black line shows Ṁout ∝ SFR1.11 observed by Arribas et al. (2014). The blue dotted line corresponds to a constant mass loading factor Ṁout/SFR of 2. Errors for Heckman et al. (2015) are 0.25 dex for Ṁout and 0.2 dex for SFR and ΣSFR. Bottom: η as a function of SFR (left), ΣSFR (middle), and S0.5 (right) for both surveys (MEGAFLOW and SIMPLE) as well as observations from B12, H15, M19, and P23. In the left panel, the dashed red line shows the prediction η ∝ SFR−0.3 from Hopkins et al. (2012) and the black line shows the fit η ∝ SFR0.11 from Arribas et al. (2014). In the middle panel, the dashed red line shows the prediction ![]() from Hopkins et al. (2012) and the black line shows the fit
from Hopkins et al. (2012) and the black line shows the fit ![]() from Arribas et al. (2014). Again, errors for Heckman et al. (2015) are 0.2 dex for SFR (and ΣSFR) and 0.45 dex for η. In the right panel, the dashed dotted black line shows η ∝ V−1 and the solid black line shows η ∝ V−2.
from Arribas et al. (2014). Again, errors for Heckman et al. (2015) are 0.2 dex for SFR (and ΣSFR) and 0.45 dex for η. In the right panel, the dashed dotted black line shows η ∝ V−1 and the solid black line shows η ∝ V−2.
Current usage metrics show cumulative count of Article Views (full-text article views including HTML views, PDF and ePub downloads, according to the available data) and Abstracts Views on Vision4Press platform.
Data correspond to usage on the plateform after 2015. The current usage metrics is available 48-96 hours after online publication and is updated daily on week days.
Initial download of the metrics may take a while.