Fig. 9
Download original image
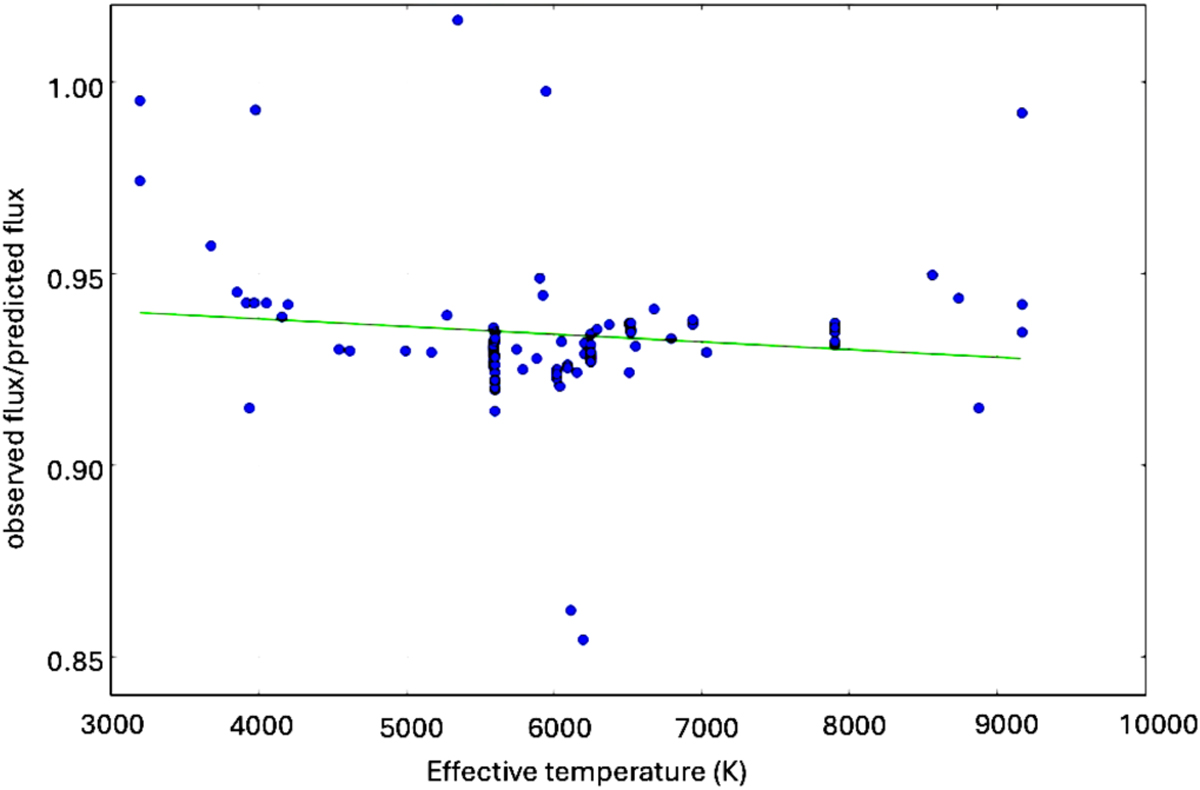
Ratio between the observed and predicted flux as a function of the stellar effective temperature. The blue dots in the plot represent over 100 measurements conducted during the IOC. Notably, the observed flux is roughly 7% lower than what was predicted by the instrument model. While the exact cause of this discrepancy remains uncertain, it is apparent that the model encompasses several sources of uncertainty that could potentially contribute to this difference. Some of these sources include uncertainties in the CALSPEC flux scale, variations in the measured optical transmission, and discrepancies in the QE, among others.
Current usage metrics show cumulative count of Article Views (full-text article views including HTML views, PDF and ePub downloads, according to the available data) and Abstracts Views on Vision4Press platform.
Data correspond to usage on the plateform after 2015. The current usage metrics is available 48-96 hours after online publication and is updated daily on week days.
Initial download of the metrics may take a while.