Fig. 7
Download original image
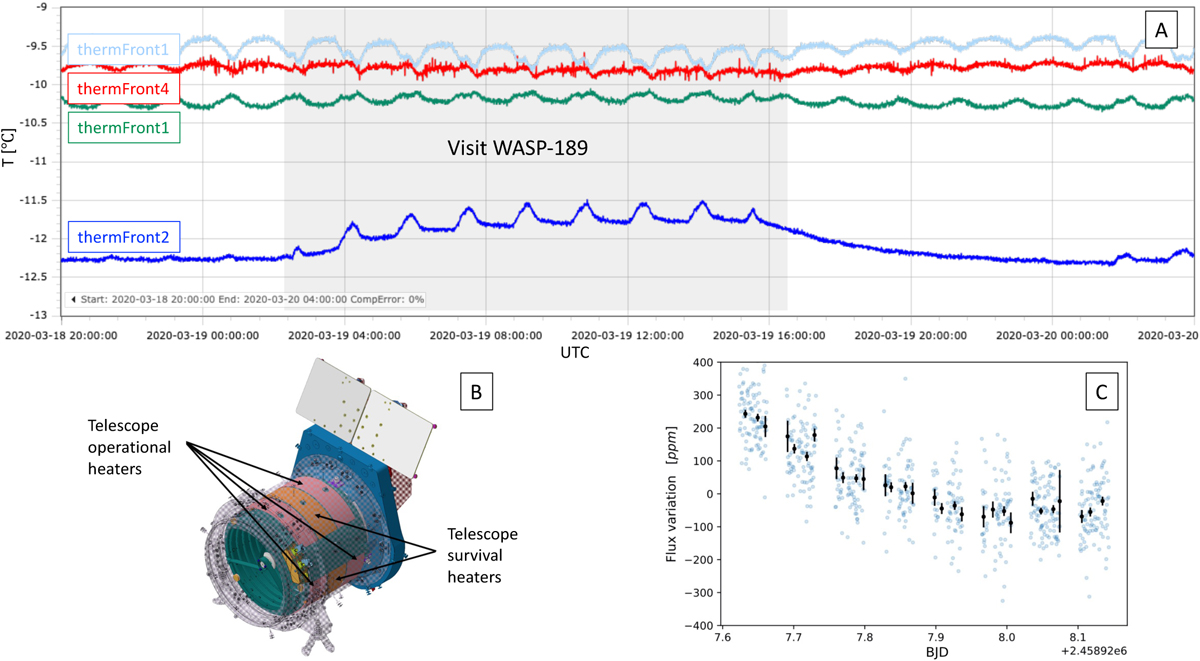
Flux ramp. Panel A: temperatures measured by the four front sensors in the telescope tube. A different colour represents each quadrant: green corresponds to the top quadrant, light blue to the bottom quadrant, red to the left quadrant, and blue to the right quadrant. The shaded area represents the duration of the first visit of WASP-189 (visit ID: CH_PR100041_TG000201). The temperature variation in the right quadrant is notably distinct from the other three quadrants, exhibiting a strong dependence on the pointing direction. While orbital oscillations are clearly discernible as spikes, the alteration in pointing direction gives rise to the more significant fluctuations in temperature. Panel B: heater rings (operational, front and rear, and survival) in the telescope tube. A gap or discontinuity in the heater rings can be seen on the right side when one is standing in front of the telescope tube. Panel C: deviations in flux from the average value during the visit of WASP-189. At the beginning, there is a downward flux ramp, a consequence of the telescope temperature variation (as discussed in Sect. 3.2.3).
Current usage metrics show cumulative count of Article Views (full-text article views including HTML views, PDF and ePub downloads, according to the available data) and Abstracts Views on Vision4Press platform.
Data correspond to usage on the plateform after 2015. The current usage metrics is available 48-96 hours after online publication and is updated daily on week days.
Initial download of the metrics may take a while.