Fig. E.2
Download original image
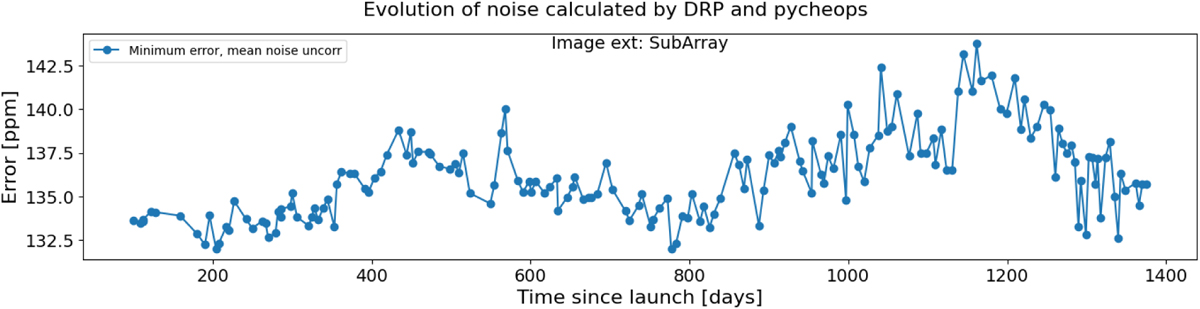
Progression of noise since the beginning of nominal operations, calculated through the PyCHEOPS package according to the minimum error algorithm (Maxted et al. 2022a). The figure shows the estimated noise of a 3 h bin by using a simulated dataset wherein hot pixels were injected into the reference visit and subsequently processed by the DRP with dark correction module OFF.
Current usage metrics show cumulative count of Article Views (full-text article views including HTML views, PDF and ePub downloads, according to the available data) and Abstracts Views on Vision4Press platform.
Data correspond to usage on the plateform after 2015. The current usage metrics is available 48-96 hours after online publication and is updated daily on week days.
Initial download of the metrics may take a while.