Fig. E.1
Download original image
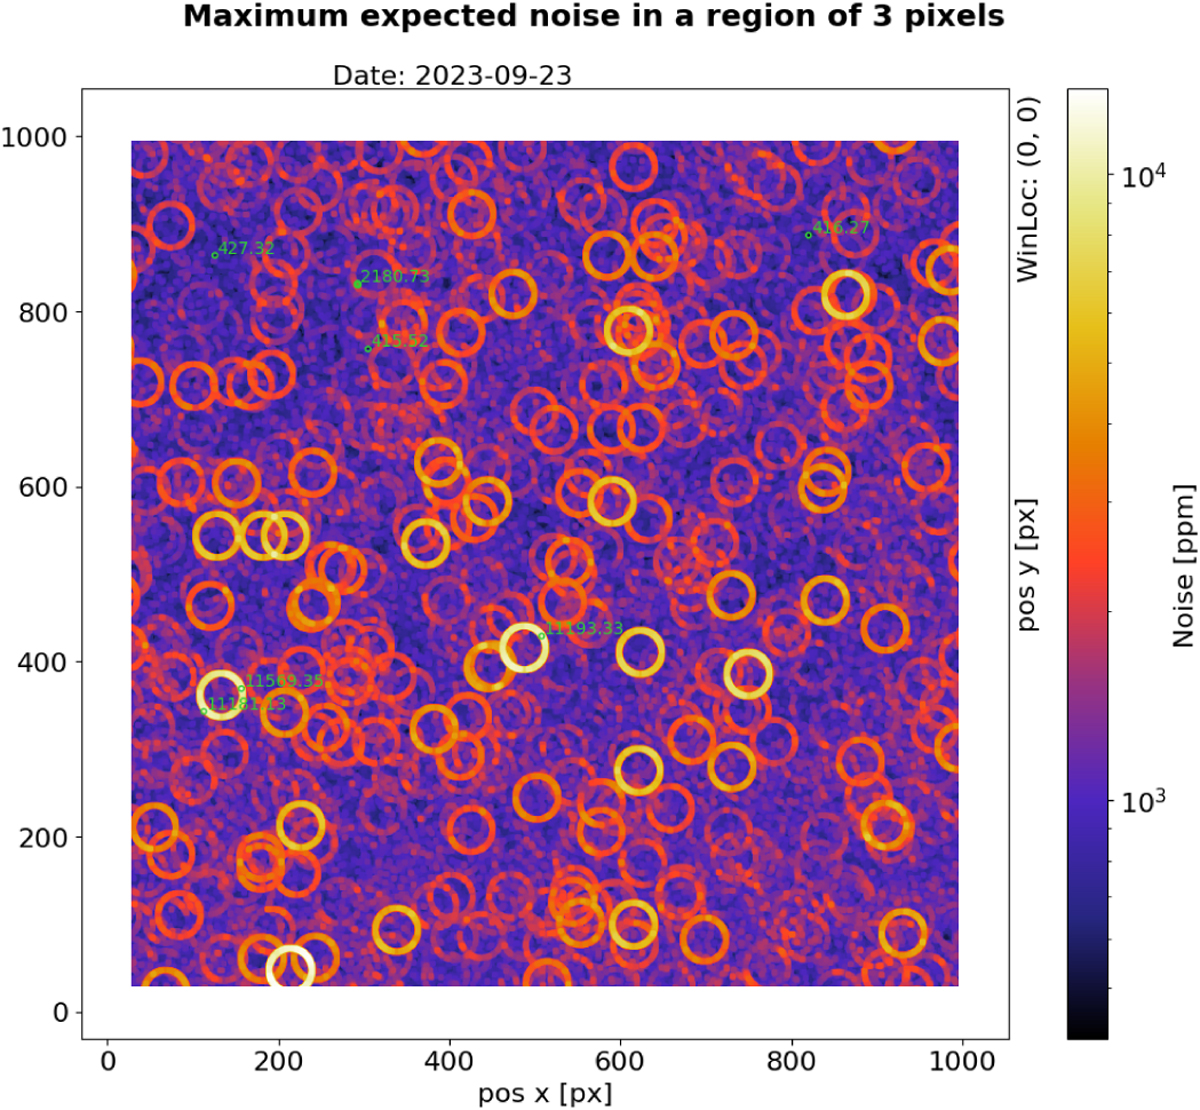
Maximum expected noise in ppm per minute due to hot pixels using the flux of a G = 12 mag star as reference. The estimations comprise two distinct noise components: shot noise and jitter noise. Jitter noise is a consequence of telescope jitter, leading to the PSF’s movement on the CCD. Consequently, the edge of the default aperture (r = 25 px) intersects hot pixels, inducing fluctuations in flux due to the hot pixels intermittently entering and exiting the aperture. The ‘noise rings’ seen in the image result from the convolution of the exact noise map with a circle of r = 3 px (all potential target locations for the intended one). That is, from all the noise values calculated in the exact map for the pixels within each circle, the maximum one is assigned to each pixel. Green circles indicate the regions of the CCD with the smallest and highest noise attributable to hot pixels.
Current usage metrics show cumulative count of Article Views (full-text article views including HTML views, PDF and ePub downloads, according to the available data) and Abstracts Views on Vision4Press platform.
Data correspond to usage on the plateform after 2015. The current usage metrics is available 48-96 hours after online publication and is updated daily on week days.
Initial download of the metrics may take a while.